Quarterly View: April 2023
Apr 14, 2023A Good Quarter for Stocks, Despite the Turmoil
Stocks climbed in the first quarter, despite regional bank collapses, additional rate increases from the U.S. Federal Reserve, ongoing war in Ukraine, concerns about a global economic slowdown, and the potential for recession. This recent rise in stock prices follows a similarly strong performance in the fourth quarter of 2022.
As we enter the first quarter earnings season, we expect stocks to remain close to current levels while investors digest the combination of managements’ adjusted outlooks for the remainder of the year, the impact of Fed rate hikes, and a potential pullback in lending by banks. The U.S. economy may avoid dipping into recession, but a slowdown is still likely. Whatever the short term may bring, we are optimistic about returns from our investments over the long term.
First Quarter Review
The S&P 500 index rose 7.5% in the first quarter, including dividends. Technology stocks rebounded sharply after underperforming last year; their large presence in major indices like the S&P 500 was one of the most important reasons for the broad market’s rally. Stocks in the communications and consumer cyclical sectors also did particularly well. Energy stocks fell with oil prices, financial stocks dropped due to concerns about regional banks, and the real estate sector declined as interest rates rose. The Bloomberg Barclays U.S. Aggregate Bond Index returned 3%, a stark reversal from bonds’ dismal performance in 2022.
The strength of the stock market may surprise many people, given the disturbing news of several regional bank collapses and ongoing efforts by the Fed to reduce inflation by slowing economic growth. Most glaring were the collapses of both Silicon Valley Bank (SVB) and Signature Bank, which we addressed in an earlier blog post (click here). We believe those failures occurred because of factors specific to those banks, including poor internal risk management, concentrated exposure to venture capital funded clients that quickly panicked at the first signs of trouble, and a large percentage of deposits above FDIC-insured limits.
We believe the problems are not spread evenly across all banks and a wider banking crisis is not imminent. Investors seemed to agree with our assessment. While the failures of SVB and Signature Bank caused regional bank stocks to plummet, shares of major banks held up better, partly due to the flow of deposits from the regionals to these larger institutions that investors perceived to be more stable.
Some believed the Fed might pause its rate hikes in March, in the wake of the bank collapses. However, the Fed remained on course with its rate hikes, boosting the federal funds rate twice during the quarter. Inflation continued to decline modestly in March, to 5.0% over the preceding 12 months, but remained far above the Fed’s stated target of 2%.
Economic reports released during the first quarter painted a mixed picture. The March employment report showed that job growth tapered but remained strong, with 236,000 new jobs reported in March and the unemployment rate down slightly to 3.5%. Two reports of fourth quarter 2022 activity offered conflicting views of economic health: U.S. GDP increased 2.6%, partly due to steady consumer spending on services, but corporate earnings dropped 4.6% as wage increases and other higher costs weighed on profit margins.
Outlook
Whether or not the U.S. economy avoids a recession, we expect economic growth to slow as the Fed continues to battle inflation with additional rate hikes. Banks may also curb lending amidst fallout from the recent regional bank collapses, the potential for tighter regulation, and concerns about the economic outlook.
Consumer spending, which accounts for about 70% of U.S. GDP, has been relatively strong but may weaken. Wage gains have slowed, easing pressure on employers and potentially dampening price increases. The question remains whether consumers will maintain spending power to keep up with inflation. If not, consumers may pull back on spending, a shift that could send the economy into recession.
Inflation will likely moderate further over the coming months. As inflation wanes and the economy slows, the Fed may pause rate hikes as soon as this year and could turn to rate cuts by 2024.
Analysts predict corporate earnings will decline close to 7% for the first quarter of 2023, which would mark the second straight quarterly drop and the largest quarterly decline since the second quarter of 2020, just after the onset of the COVID-19 pandemic. Analysts currently forecast a resurgence of earnings growth later in 2023 and a slight increase in earnings for the full year, but we expect a decline in earnings for all of 2023.
Given our expectation of a slowing economy and lower earnings, what are the implications for investment opportunities and potential returns? With the broad stock market still trading almost 15% below the peak levels at the end of 2021, we like the prospects of the stocks we own in our portfolios and have been able to find new stocks to add to our holdings at prices that we consider attractive for long-term returns. The S&P 500 index currently trades for about 18x estimated earnings for the next twelve months, lower than the average over the past five years, and we believe there are specific stocks trading for significant discounts to their fair values.
Meanwhile, the rise in interest rates has made bonds much more attractive. We welcome yields of more than 4% on short-term Treasurys and other bonds after many years of paltry returns on fixed income securities. Other sectors of the bond market, such as floating rate notes, select high-yield bonds, and municipal bonds, also offer appealing yields and prospective returns currently.
As always, we will be closely watching economic indicators and the Fed’s actions over the coming months. We are optimistic that fallout from the recent issues with regional banks will be limited and are prepared for an economic slowdown that we expect will be short-lived. We do not anticipate significant changes to our portfolios but remain on the lookout for good long-term investment opportunities.
Portfolio Changes
We recently completed the sale of two international funds, one for developed world exposure and the other for emerging markets. As a replacement, we purchased a single international fund, Dimensional World ex US Core Equity 2 ETF (DFAX). This fund provides broadly diversified exposure to both developed and emerging markets outside the United States. We like the fund manager’s attention to the split between developed and emerging markets investments, focus on investing in undervalued, smaller companies, and management of risk through selective exposure to individual countries.
Analysis of Selected Securities[i]
The following is a discussion of several securities we own and have bought recently. Due to factors specific to each company, these securities are, in our opinion, priced attractively in the markets today.
Amazon.com, Inc. (AMZN)
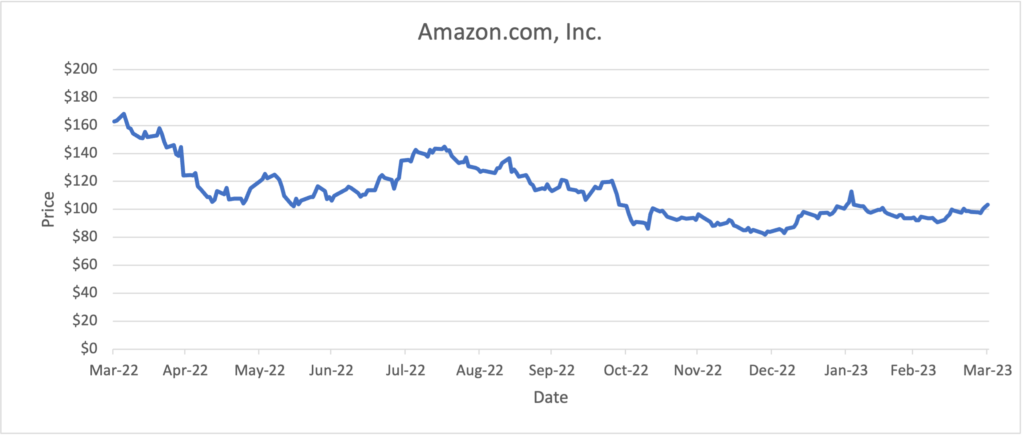
Price (3/31/2023): $103.29 Forward P/E: 58.5
Market Cap ($T): $1.0 Price/Book: 6.9
Dividend Yield: 0.0% Price/Sales: 1.9
Return on Equity: -1.9% Debt/Equity: 1.0
Sources: Morningstar, YCharts
Based in Seattle, Washington, Amazon.com, Inc. is a multinational technology company and one of the largest online retailers in the world. The company’s core business areas include online retail, cloud computing through Amazon Web Services (AWS), digital entertainment via Prime Video, smart home technology with Alexa, e-readers through Kindle, and physical grocery stores with Whole Foods. In 2022, Amazon reported revenue of $514 billion, solidifying its status as one of the world’s largest companies.
Despite operating in highly competitive sectors such as e-commerce, cloud computing, and digital entertainment, Amazon has built numerous competitive advantages, including a broad and diverse product and service portfolio, an extensive logistics network, substantial investments in technology and innovation, and economies of scale. Accumulated over many years, these competitive advantages have enabled the company to maintain a dominant position. Potential competitors face challenges such as substantial initial costs and the ongoing need for significant reinvestment.
Amazon continuously seeks profitable growth opportunities by capitalizing on its substantial advantages in e-commerce and cloud computing. Recent endeavors aimed to enhance Amazon’s long-term growth potential and customer loyalty include expanding the company’s advertising business, which offers marketers access to a large audience of motivated buyers, proprietary data, and a high return on advertising spend. Additionally, Amazon was the first to provide public cloud infrastructure as a service through AWS and still holds a considerable lead over its closest rival. AWS is well-positioned to benefit from the ongoing shift towards cloud computing and continues to be one of Amazon’s highest growing segments, accounting for 16% of 2022 revenue.
Although Amazon reported solid fourth quarter results, its first quarter outlook was below expectations. The company noted that the mixed outlook for both consumer and corporate spending broadly and higher near-term operating costs from the company’s buildout during the COVID-19 pandemic will weigh on Amazon’s performance throughout 2023, with potential improvements expected in 2024. Amazon has made progress on operational efficiency, and we anticipate long-term growth from e-commerce proliferation, AWS, and advertising. Amazon has also focused on third-party seller initiatives to help utilize overbuilt capacity, creating new opportunities for growth while leveraging its existing infrastructure. Amazon’s unique ability to transform an operational issue into a future revenue growth engine remains one of the company’s most undervalued strengths.
Amazon’s shares trade at an elevated price to forward earnings ratio of 58.5x, which is slightly below the five-year average of 67.9x. Amazon’s valuation is more reasonable based on its price to sales ratio, currently 1.9x relative to the five-year average ratio of 3.7x, a discount that we expect to be temporary. We like that Amazon is taking strategic steps to maintain its competitive edge and continue its expansion. We still view Amazon’s shares favorably given its strong market position and attractive future earnings potential.
BlackRock, Inc. (BLK)

Price (3/31/2023): $669.12 Forward P/E: 19.5
Market Cap ($B): $100.1 Price/Book: 2.7
Dividend Yield: 3.0% Price/Sales: 5.7
Return on Equity: 13.7% Debt/Equity: 0.2
Sources: Morningstar, YCharts
BlackRock, Inc. is the largest asset manager in the world, with nearly $8.6 trillion in assets under management at the end of 2022 and clients in more than 100 countries. The financial services giant offers a variety of investing products to institutional and individual investors, including both active and passive strategies through exchange-traded funds (ETFs), separate accounts, mutual funds, and other pooled investment vehicles.[ii]
BlackRock is the largest ETF provider in the world through its iShares franchise. BlackRock acquired iShares from Barclays in 2009 and has grown assets under management in its ETFs to $2.9 trillion at the end of 2022. Aladdin, BlackRock’s investment management system, offers portfolio management, trading, compliance, operations, and risk oversight to clients and accounted for roughly 10% of 2022 revenue.
BlackRock’s large size and breadth of investing products and the strength of its brands have helped differentiate it from competitors and attract client assets on an impressive scale. This scale allows BlackRock to offer its products at lower fees while still generating strong operating margins.
Weakness across financial markets during 2022 weighed on BlackRock’s performance, as declines in assets under management led to lower fee revenue. Despite the volatile market conditions, BlackRock saw long-term asset inflows of $393 billion for the year, a sign of confidence from clients. BlackRock’s product distribution is weighted more heavily toward institutional clients, which have traditionally been more stable than individual retail investors. Additionally, BlackRock’s diversified product offerings help mitigate the negative impact of any particular asset class decline on overall performance.[iii] BlackRock continues to look for opportunities to expand and enhance its investment products, including a recent push into alternative assets and sustainable investing.
BlackRock has a sound balance sheet with low levels of debt. Its business model generates healthy operating margins and strong free cash flow, which BlackRock uses to return to shareholders via both share repurchases and dividends. Shares currently trade at a price to forward earnings ratio of 19.5x, slightly above their five-year average ratio of 18.4x. Management’s goal is to pay out 40% to 50% of its earnings as dividends, and BlackRock’s shares have an above average yield of 3.0%, which we find attractive.
Merck & Co., Inc. (MRK)
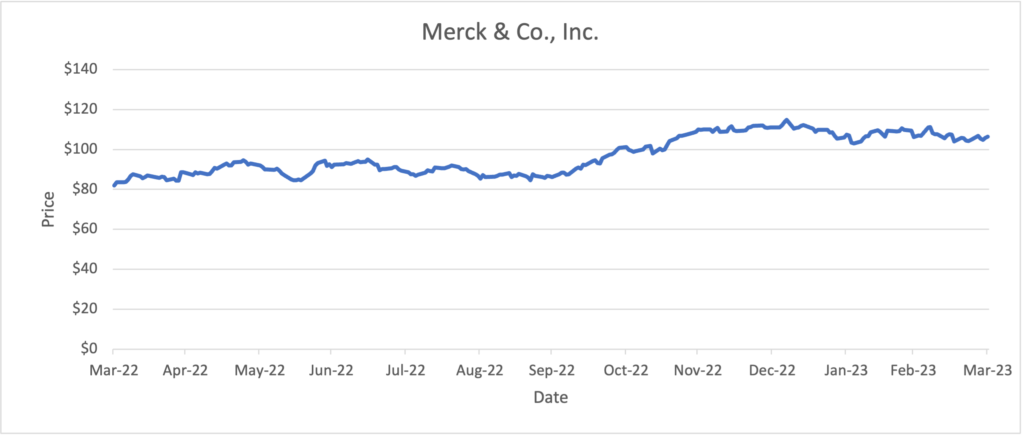
Price (3/31/2023): $106.39 Forward P/E: 16.3
Market Cap ($B): $290.9 Price/Book: 6.3
Dividend Yield: 2.6% Price/Sales: 4.9
Return on Equity: 34.5% Debt/Equity: 0.6
Sources: Morningstar, YCharts
Pharmaceutical company Merck & Co., Inc. produces prescription drugs and vaccines for a broad range of therapeutic areas. The United States is Merck’s largest market, accounting for roughly half of 2022 sales. Merck’s three largest products are its cancer therapy Keytruda (35% of 2022 sales), HPV vaccine Gardasil (12%), and oral COVID-19 treatment Lagevrio (10%). In addition to human pharmaceuticals and vaccines, Merck also has an animal health segment (10% of 2022 sales), which develops and markets pharmaceutical and vaccine products for the prevention, treatment, and control of disease in livestock and companion animals.
First approved by the FDA in 2014 as a backup treatment for melanoma, Keytruda has become an integral part of Merck’s product portfolio and a primary driver of earnings growth. Merck has been able to expand the uses of Keytruda into more lucrative primary treatments, for which more prescriptions are written, and into cancers with the largest patient populations. Keytruda has now been approved for more than 30 uses across a broad range of cancer types and is patent protected until 2028, which should help mitigate generic competition and allow Merck to continue building out its pipeline of drugs. Merck recently extended its partnership with Moderna to jointly develop personalized cancer vaccines to be used in combination with Keytruda, adding long-term potential for individualized cancer treatment.
Another significant growth driver for Merck over the past year was its oral COVID-19 treatment Lagevrio, which the FDA approved for Emergency Use Authorization in December 2021. After providing a boost to earnings in 2022, sales of Lagevrio will likely decline during 2023 as COVID-19 treatment demand wanes. Although Merck’s total sales growth should moderate during 2023 as a result, we believe Merck will continue to benefit over the long term from the strong outlook for both Keytruda and its HPV vaccine Gardasil.
Merck returned 34%, including dividends, over the last twelve months, outperforming the S&P 500’s 8% decline over the same period. This outperformance has garnered Merck a premium valuation, currently trading at a price to forward earnings multiple of 16.3x compared to its historical five-year average multiple of 14.0x. We still view the shares favorably given Merck’s long-term prospects. Although potential U.S. drug price policy reform poses a threat to the pharmaceutical industry, we believe Merck will continue to generate strong cash flows from its diverse portfolio of pharmaceutical products. Additionally, Merck has a history of using these cash flows to pay its shareholders a steady dividend, with shares currently yielding 2.6%.
Disclosures
This material represents an assessment of the market and economic environment at a specific point in time and is not intended to be a forecast of future events or a guarantee of future results. Forward-looking statements are subject to certain risks and uncertainties. Actual results, performance, or achievements may differ materially from those expressed or implied. Information is based on data gathered from what we believe are reliable sources. It is not guaranteed as to accuracy, does not purport to be complete, and is not intended to be used as a primary basis for investment decisions. It should also not be construed as advice meeting the particular investment needs of any investor. Past performance does not guarantee future results.
Indices are unmanaged, and investors cannot invest directly in an index. Unless otherwise noted, performance of indices does not account for any fees, commissions, or other expenses that would be incurred.
The S&P 500 index is an unmanaged group of securities considered to be representative of the stock market in general. It is a market value-weighted index with each stock’s weight in the index proportionate to its market value.
The Bloomberg Barclays U.S. Aggregate Bond Index is a broad-based market capitalization-weighted bond market index representing intermediate term investment grade bonds traded in the United States. Investors frequently use the index as a proxy for measuring the performance of the U.S. bond market.
Exchange Traded Funds (ETF’s) are sold by prospectus. Please consider the investment objectives, risks, charges, and expenses carefully before investing. The prospectus, which contains this and other information about the investment company, can be obtained from the Fund Company or your financial professional. Be sure to read the prospectus carefully before deciding whether to invest.
[i] Portfolio holdings are subject to change without notice. All recommendations are based upon our experience and may or may not have been profitable in the past, now or in the future.
[ii] Active portfolio management, including market timing, can subject longer term investors to potentially higher fees and can have a negative effect on the long-term performance due to the transaction costs of the short-term trading. In addition, there may be potential tax consequences from these strategies. Active portfolio management and market timing may be unsuitable for some investors depending on their specific investment objectives and financial position. Active portfolio management does not guarantee a profit or protect against a loss in a declining market.
[iii] Diversification does not guarantee a profit or protect against a loss in a declining market. It is a method used to help manage investment risk.