Quarterly View: April 2024
Apr 17, 2024- The U.S. economy showed signs of health in the first quarter as employment remained strong, despite the Fed’s wishes for moderation in economic growth and hiring.
- The S&P 500 index rose 10.6%, including dividends, during the first quarter.
- Inflation continued to hover in the 2.5%-3.5% range, far below the 9%-plus rates seen in 2022.
- We are optimistic that the economy will continue to expand, thanks partly to the anticipated Fed rate cuts later this year.
- We believe global economic conditions are positive overall and should support corporate earnings increases and further stock market gains.
Stocks Surge to New Records
The stock market surged in the first quarter of 2024, delivering the best start to a year since 2019 and hitting 22 all-time closing highs along the way. The rally was broad and included small capitalization stocks and others that had lagged for much of 2023.
Investors continue to parse statements from the Federal Reserve Board and economic reports to try to figure out whether the economy can continue to expand while the Fed attempts to bring inflation down to its 2% target rate. So far, the Fed seems to be threading the needle and achieving its objective, though there are still some signs that inflation is proving to be more persistent than hoped. We are encouraged by the progress and remain optimistic that the U.S. economy can avoid recession and that stocks will provide appealing returns for the remainder of this year.
First Quarter Review
The S&P 500 index rose 10.6%, including dividends, during the first quarter, a fantastic start to the year after a strong finish in 2023. This gain occurred despite disappointing performance from Apple and Tesla, two behemoths that helped boost the market in recent years. Small capitalization, industrial, and financial services stocks climbed, an encouraging sign of more widespread market strength. Over one-half of S&P 500 index stocks reached new 52-week highs, another indication of the breadth of the gains.
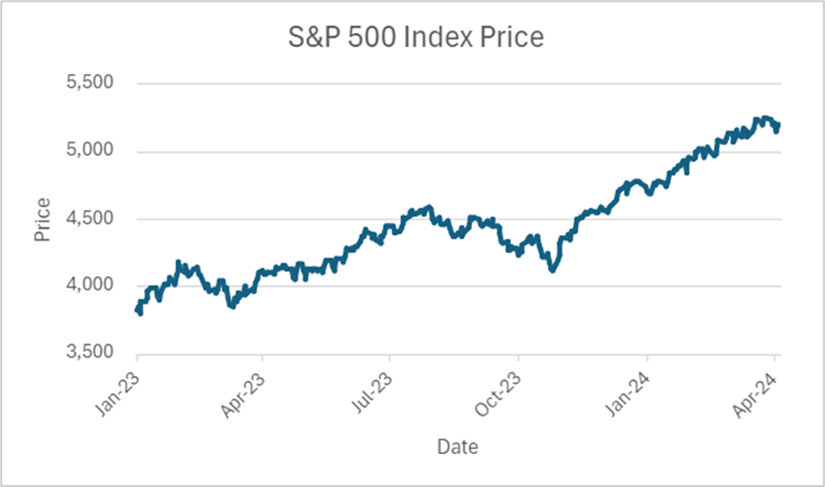
Source: YCharts
Bond prices suffered as investors tempered their expectations of Fed rate cuts in 2024. At the beginning of January, markets predicted at least three cuts during this year. Given the Fed’s recent focus on persistent inflation, investors concluded that the number of cuts may be lower than previously expected. Accordingly, bond yields rose during the quarter, prices declined, and the Bloomberg Barclays U.S. Aggregate Bond Index returned -0.8%.
The U.S. economy remained strong and continued to grow, though at a slower rate. The most recent update to fourth quarter 2023 gross domestic product showed an increase of 3.4%, following 4.9% growth in the third quarter. Supply chain issues dating back to the pandemic have mostly healed, and even the recent bridge disaster in Baltimore seems unlikely to cause major problems for the flow of goods around the world. Consumer spending increased, providing important support for the economy, and the manufacturing sector expanded in March for the first time since September 2022.
Businesses continue to hire, despite uncertainty regarding interest rates and inflation. The 303,000 jobs added in March trounced forecasts and was higher than the average of 231,000 over the past year, causing the unemployment rate to dip slightly to 3.8%. Wages increased 4.1% since March 2023, but they rose less than in recent months, a good sign for the Fed as it tries to reduce inflation without disrupting the economy.
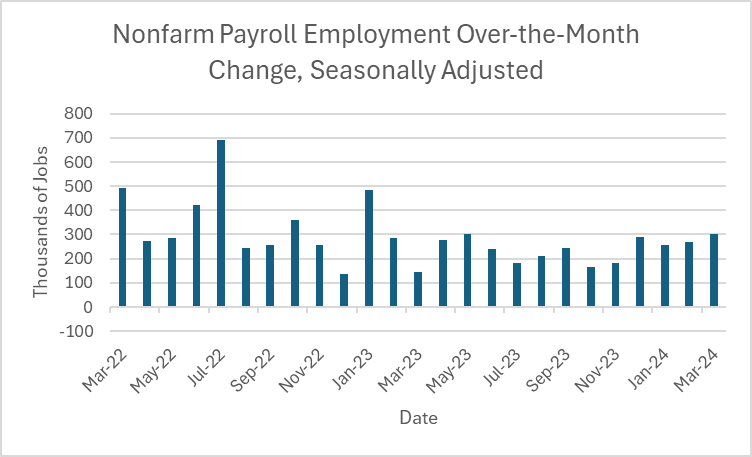
Source: Bureau of Labor Statistics
Inflation continued to hover in the 2.5%-3.5% range, depending on the measure used, far below the 9%-plus rates seen in 2022. Productivity increases have partially offset the effect of rising wages on inflation, and the latest Personal Consumption Expenditures (PCE) price index reading was 2.5% annually, close to the Fed’s 2% target rate. However, there are signs that the final push to 2% inflation may be more difficult than the drastic drop from 2022 levels, including recent increases in oil prices due to concerns over the conflict in the Middle East that may make the Fed’s task to reduce inflation harder.
Outlook
As the second quarter of 2024 begins, investors are showing some signs of nervousness regarding the timing and number of Fed interest rate cuts this year and the subsequent impact on the economy and markets. The most recent economic reports confirm a healthy economy and robust employment, potentially unsettling to the Fed, who would like to see some moderation in economic growth and hiring before cutting rates.
We are optimistic that the economy will continue to expand, thanks partly to anticipated Fed rate cuts later this year, and inflation will trend closer to the Fed’s 2% target over the coming quarters. We believe stocks should be able to add to their gains as the economic backdrop remains positive and corporate earnings rise.
The presidential election looms and will grab headlines for the remainder of the year, but we think other news will have a more fundamental impact on the markets and economy. Inflation’s path, the employment situation, the Fed’s actions, and corporate earnings will be most important, as will the impact of the conflicts in Ukraine and the Middle East and their potential to spread.
We expect the Fed to lower rates later this year as inflation continues to moderate, though the rate cuts may be fewer and later than we expected at the beginning of the year. Like the U.S. Fed, the European Central Bank and Bank of England are turning to interest rate cuts to avoid economic contraction, though they are also grappling with mixed signals regarding their own economic health and inflation.
In Asia, Japan’s economy and stock market have surged as the Bank of Japan ended its longstanding policy of negative interest rates. Meanwhile, China is mired in various issues negatively affecting its economy and stock market, including demographics, high debt levels, and geopolitical tensions. Despite these challenges in the world’s second–largest economy, we believe global economic conditions are positive overall and should support corporate earnings increases and further stock market gains.
According to FactSet, S&P 500 index earnings likely increased about 1% in the first quarter, which would be a third straight quarter of growth following a gain of 4% in the fourth quarter of 2023. For the full year, analysts currently expect earnings growth to reach 10%, though estimates typically moderate during the year.
Following strong recent performance, the S&P 500 index now trades near an all-time high price and at 20.6 times expected earnings for the next twelve months, up from 19.5 times at the end of 2023. This multiple is above historical averages of 19.1 times over the past five years and 17.8 times over the past ten years. Nevertheless, we believe that the prospects of ongoing economic growth, lower interest rates, and increased corporate earnings will provide attractive returns for stocks over the long term.
With interest rates still high, we continue to hold bonds in the income allocations of our portfolios. We have slightly increased our exposure to longer-term bonds in anticipation of interest rate declines and may add more to these holdings as the likely timing and magnitude of rate cuts becomes clearer.
Further Analysis of Stock and Bond Markets
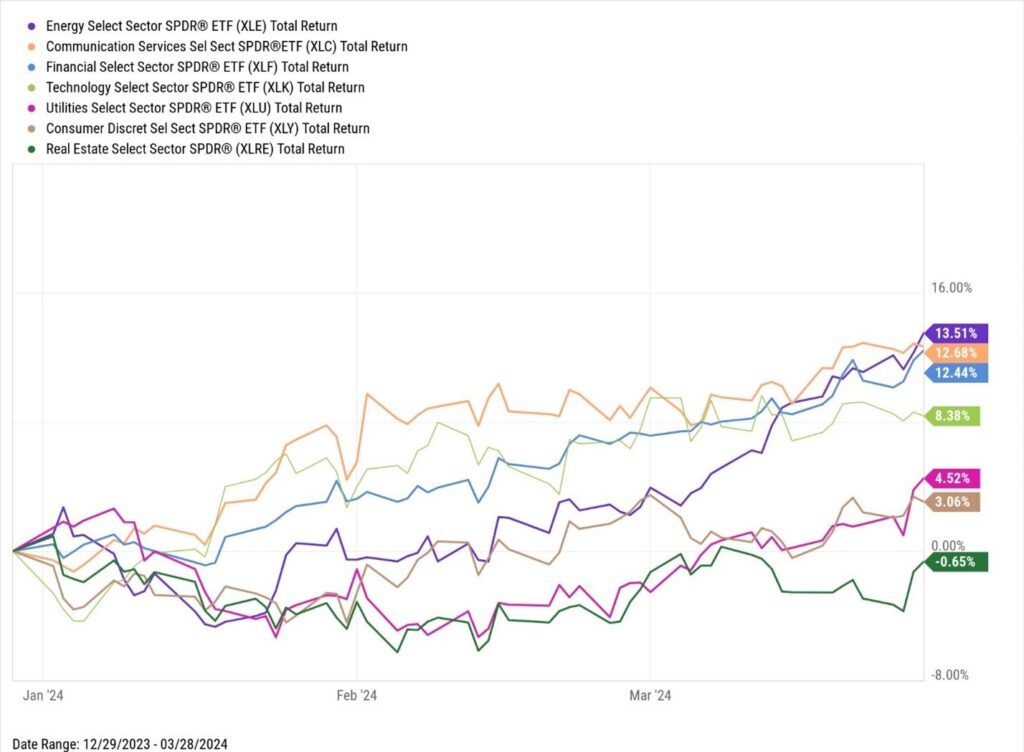
Source: YCharts
The rise in stocks during the first quarter of 2024 continued to be wide-ranging, with ten of the eleven sectors in the S&P 500 index notching gains to start the year. The top three performing sectors were energy, communication services, and financials. Notably, energy stocks rebounded after being one of the worst performing sectors during 2023 as crude oil prices increased by more than 10% compared to the beginning of the year and approached $90 a barrel. Additionally, stocks in the financial sector continued their rise on hopes for easing financial conditions after the regional banking crisis last year.
Despite various news headlines about artificial intelligence and Nvidia’s blockbuster performance, the technology sector’s return, including dividends, for the first quarter of 8.4% was below the S&P 500’s total return of 10.6% and ranked in the bottom half of all S&P 500 sectors. Representing roughly 20% of the S&P 500’s technology sector, Apple dragged down the sector’s overall performance during 2024 after almost doubling the S&P 500’s performance in 2023 and being known as one of the seven stocks driving market returns last year. Apple has trailed the S&P 500 to start the year with a return, including dividends, of -10.8% due to investor fears over slowing phone sales in China, an underwhelming rollout of artificial intelligence across its products, and a landmark antitrust fine by the European Union.
The bottom three performing sectors during the first quarter of 2024 were utilities, consumer discretionary, and real estate. Utility and real estate stocks, in particular, are more sensitive to interest rates and continue to feel the pressure of higher rates. The real estate sector was the only sector in the S&P 500 to post a negative return during 2024 as investors continued to worry about stress on commercial real estate from higher vacancy rates and lower demand for office space due to hybrid work schedules. Similar to Apple’s effect on the technology sector’s performance, Tesla was a drag to the overall consumer discretionary sector’s performance during 2024. Representing roughly 15% of the sector, Tesla’s return of -29.3% for the first quarter was a standout compared to the rest of consumer discretionary stocks and one of the worst returns in the S&P 500 index.
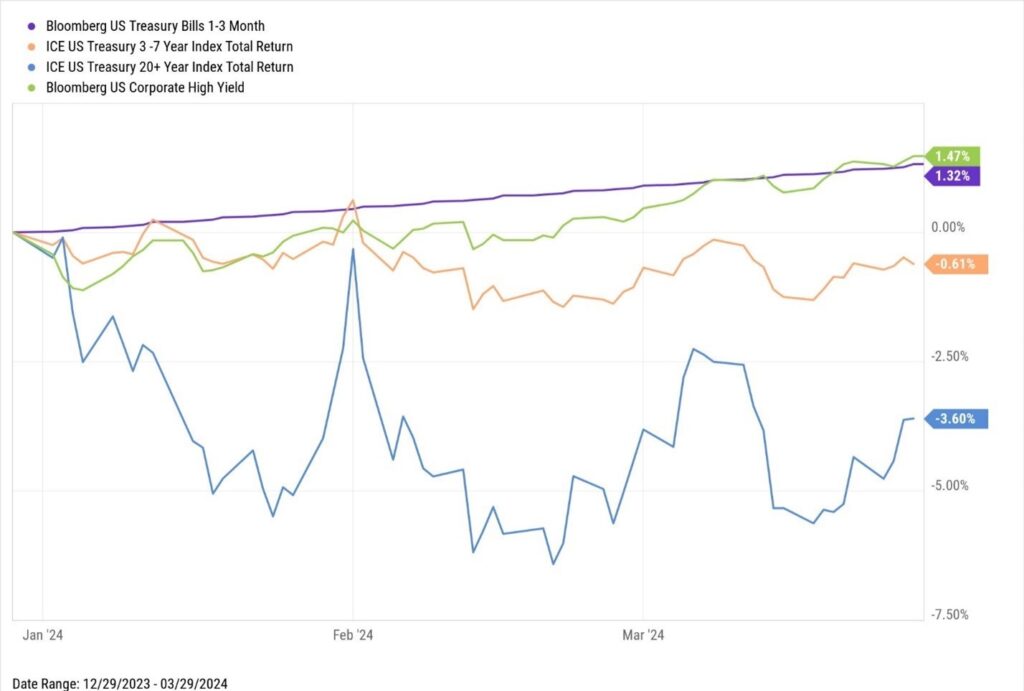
Source: YCharts
Uncertainty over the timing and extent of rate cuts by the Fed dampened bond returns during the first quarter of 2024. Longer-dated bonds sold off, while short-term bonds continued to reward investors with higher rates and positive returns. The yield curve has been inverted since early July 2022, an uncommon condition in which short-term yields are higher than long-term yields, marking one of the longest stretches ever recorded in U.S. history. Although an inverted yield curve can signal an upcoming recession, the economy has remained remarkably resilient. In this environment of economic strength, riskier high yield bonds continued to perform well as default rates remained low.
Security Highlight: The Hershey Company (HSY)
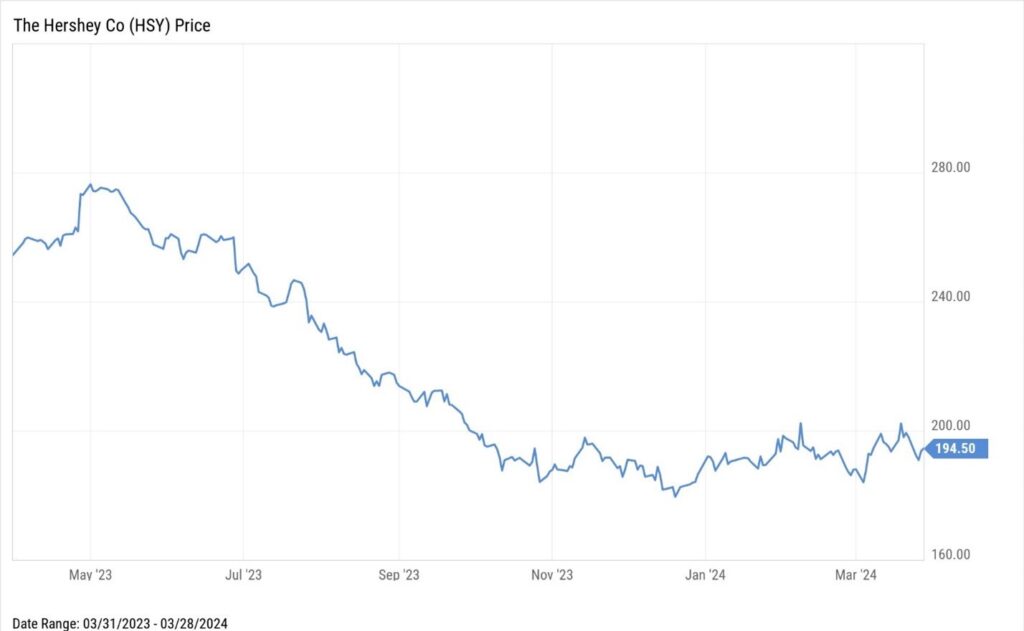
Price (3/28/2023): $194.50 Forward P/E: 19.4
Market Cap ($B): $37.4 Price/Book: 9.6
Dividend Yield: 2.8% Price/Sales: 3.5
Return on Equity: 50.3% Debt/Equity: 1.3
Sources: YCharts, Morningstar
The Hershey Company, headquartered in Hershey, Pennsylvania, is a global confectionery and snack company. With a rich history dating back to its establishment in 1894, Hershey has grown into a major food company, employing over 18,650 individuals worldwide. The company manufactures and distributes a wide range of products, including chocolate and non-chocolate confectionery, gum and mints, pantry items such as baking ingredients, toppings, and beverages, and snack items like spreads, bars, and snack bites. Hershey markets its products under well-known brand names such as Hershey’s, Reese’s, Kisses, Jolly Rancher, and Ice Breakers, which are found in grocery stores, mass merchandisers, convenience stores, and vending companies across the globe.
In the highly competitive chocolate and confectionery industry, Hershey stands out due to its strong brand recognition, extensive product portfolio, and robust distribution network. The company’s competitive advantage is further bolstered by its commitment to quality and taste, which has helped it build a loyal customer base over the years. Hershey’s innovation in product development and marketing strategies has enabled it to maintain a leading position in the industry, despite facing intense competition from other global and local companies like Mars, Nestlé, and Cadbury.
We believe that Hershey has attractive growth prospects, particularly in emerging markets with growing middle-class populations and increasing disposable incomes. Furthermore, the company’s strategic acquisitions and partnerships have been instrumental in diversifying its product offerings and entering new markets.
Hershey faces challenges such as fluctuating raw material prices and changing consumer preferences towards healthier food options. Recently, cocoa beans, the main ingredient in most of Hershey’s offerings, have been selling for all-time high prices, reflecting a poor harvest in Western Africa, a region that accounts for over 70% of global cocoa production. Despite these challenges, the company reported strong financial results for 2023 and has grown revenues by more than 7% annually over the last five years. Management is also optimistic that it can increase prices to offset higher cocoa costs in the coming years as part of its multi-year strategy to manage cost inflation.
Hershey has a sound balance sheet, with lower debt levels than many of its peers, and strong pricing power which results in attractive margins. Additionally, Hershey’s commitment to return profits and boost shareholder value is evident in its dividend policy, with the company paying $889 million in cash dividends in 2023. This financial stability, combined with strategic investments in capacity expansion, positions Hershey for sustained growth and profitability in the competitive confectionery and snack industry.
We believe the pullback in share price over the last twelve months has created an attractive opportunity for long-term investors to become partial owners of an iconic business at a very reasonable price. Indeed, with Hershey shares currently trading at a price to forward earnings multiple of 19x, below their historical five-year average multiple of 24x, we believe that this opportunity is too sweet to pass up.
Disclosures
This material represents an assessment of the market and economic environment at a specific point in time and is not intended to be a forecast of future events, or a guarantee of future results. Forward-looking statements are subject to certain risks and uncertainties. Actual results, performance, or achievements may differ materially from those expressed or implied. Information is based on data gathered from what we believe are reliable sources. It is not guaranteed as to accuracy, does not purport to be complete and is not intended to be used as a primary basis for investment decisions. It should also not be construed as advice meeting the particular investment needs of any investor. Past performance does not guarantee future results.
Indices are unmanaged and investors cannot invest directly in an index. Unless otherwise noted, performance of indices does not account for any fees, commissions or other expenses that would be incurred. Returns do not include reinvested dividends.
The Standard & Poor’s 500 (S&P 500) Index is a free-float weighted index that tracks the 500 most widely held stocks on the NYSE or NASDAQ and is representative of the stock market in general. It is a market value weighted index with each stock’s weight in the index proportionate to its market value.
The Bloomberg Barclays US Aggregate Bond Index, or the Agg, is a broad base, market capitalization-weighted bond market index representing intermediate term investment grade bonds traded in the United States. Investors frequently use the index as a stand-in for measuring the performance of the US bond market.
The PCE price index (PCEPI), also referred to as the PCE deflator, PCE price deflator, or the Implicit Price Deflator for Personal Consumption Expenditures (IPD for PCE) by the BEA, and as the Chain-type Price Index for Personal Consumption Expenditures (CTPIPCE) by the Federal Open Market Committee (FOMC), is a United States-wide indicator of the average increase in prices for all domestic personal consumption. It is benchmarked to a base of 2012 = 100. Using a variety of data including U.S. Consumer Price Index and Producer Price Index prices, it is derived from the largest component of the GDP in the BEA’s National Income and Product Accounts, personal consumption expenditures.
Exchange Traded Funds (ETF’s) are sold by prospectus. Please consider the investment objectives, risks, charges, and expenses carefully before investing. The prospectus, which contains this and other information about the investment company, can be obtained from the Fund Company or your financial professional. Be sure to read the prospectus carefully before deciding whether to invest.