Quarterly View: December 2023
Jan 10, 2024- Stocks surged in the fourth quarter of 2023, defying most predictions, and the S&P 500 index ended the year up 26.3%.
- Technology stocks led the market, while small caps outperformed large caps in the fourth quarter.
- Inflation continued to decline, and the Federal Reserve predicted a turn to rate cuts in 2024.
- Employment remained healthy with a 3.7% unemployment rate, but some signs of a softening job market emerged. Consumer sentiment rose and spending was strong through the holiday season.
- We expect another good year for stocks and the economy in 2024, though both market returns and economic growth will likely be lower than in 2023.
Sprint to the Finish
Stocks surged in the fourth quarter of 2023 to cap a fantastic year for investors, despite early-year predictions of a recession and weak stock market returns. The strong performance of the U.S. economy and stock market boosted hopes that interest rate hikes made by the Federal Reserve will decrease inflation to acceptable levels without triggering a recession
We are optimistic that the market’s current run will continue into 2024, though returns for the year are not likely to match those in 2023. We also believe that economic growth will slow from last year’s pace, but the United States economy will likely avoid a recession. Stocks are trading near all-time highs and at premium multiples of earnings compared to the beginning of the fourth quarter. Nevertheless, we still see room for gains as corporate earnings continue to improve.
Fourth Quarter Review
Following a slump in the third quarter, stocks rebounded sharply in October and rose steadily through year end. The S&P 500 index gained 11.7% during the fourth quarter, including dividends, ending the year up 26.3%. Bonds also did well as interest rates declined. The Bloomberg Barclays US Aggregate Bond Index delivered a 5.5% return for the full year, a great improvement over 2022’s dismal return of -13%.
Source: YCharts
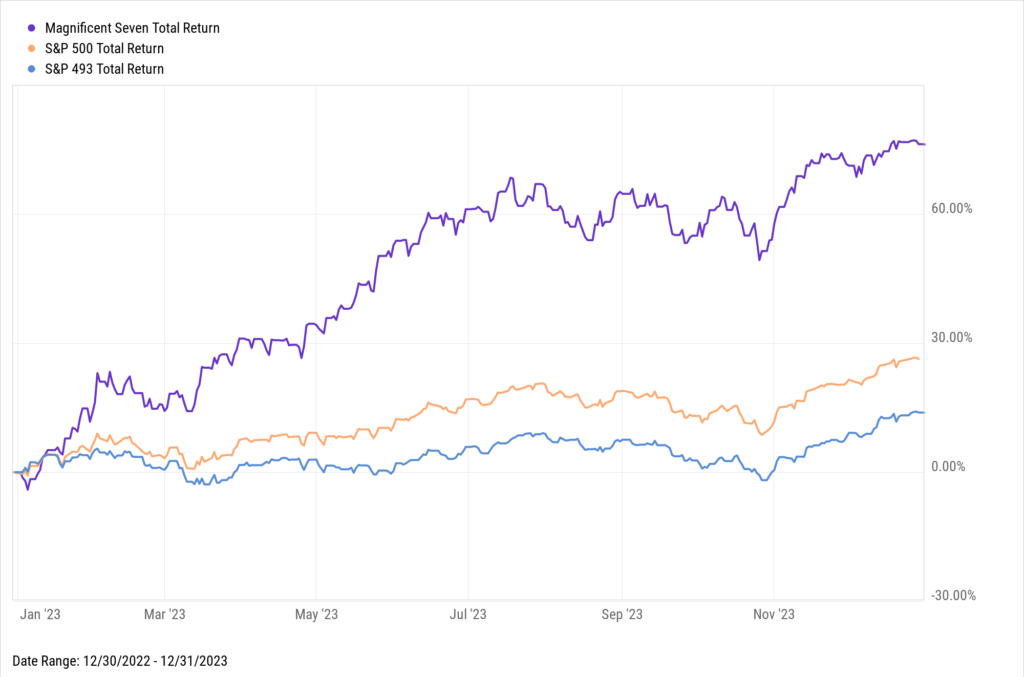
After a disappointing performance in 2022, technology stocks led the charge in 2023, boosted in part by excitement regarding the prospects for artificial intelligence to create new business opportunities. Given their large size relative to other companies and sectors, tech companies’ stocks continue to have a major impact on the broader market’s performance. Excluding the seven tech-heavy companies that dominated the market’s performance, the S&P 500 index gained 13% in 2023, only about one-half the gain for the full index.
Small capitalization stocks outperformed large caps in the fourth quarter, particularly in December when the markets began to forecast interest rate cuts in 2024. Foreign stocks also did well, rising 9.8% in the fourth quarter and 15.6% overall in 2023.

Source: New York Times; Bureau of Labor Statistics
The Fed’s efforts to reduce inflation to the target rate of 2% continued to preoccupy investors throughout the quarter. The Fed held rates steady as the Personal Consumption Expenditures (PCE) price index, the Fed’s preferred measure of inflation, declined further. This index reached an annual rate of 2.6% through November, as supply constraints eased and prices for food and energy decreased. Excluding prices for food and energy, which tend to be more volatile, inflation over the past six months was 1.9%, just below the target rate. The prices consumers pay, however, are still much higher than they were before the pandemic hit in 2020.
Employment remained healthy in the fourth quarter, as the job market showed resiliency by withstanding the effects of interest rate increases earlier in the year and defying predictions of a significant hiring slowdown. Employers hired at a robust rate, and the unemployment rate fell to 3.7%. There were some signs of a softening job market as the number of job openings declined and hiring slowed from the rapid pace of the past few years. However, real wages (wages adjusted for inflation) increased as inflation slowed, leaving workers with more money to spend. Consumer sentiment rose, and holiday retail sales were up 3.1% compared to 2022, an indication of consumer spending strength despite higher interest rates, decreased savings, and resumption of student loan repayments.
Partly due to rising consumer expenditures, the U.S. economy continued to expand, with updated results for third quarter gross domestic product (GDP) released in December showing a 4.9% rise. Fourth quarter GDP likely increased but at a lower rate, most likely 1% to 2%, significantly better than expectations entering 2023.
Outlook
Stock prices have stalled as we enter 2024, which is not surprising after nine straight weeks of gains to finish last year. Nevertheless, we believe stocks should be able to deliver positive returns this year, though below their remarkable performance in 2023, as the economy remains on its steady path and avoids slipping into recession.
All eyes remain on inflation, the Fed, and the impact of higher interest rates on the economy. Most analysts currently expect the Fed to reduce interest rates three times during the year to bring the federal funds rate to a range of 4.5% to 4.75%, 0.75% below the current level. If inflation continues to decline and economic growth slows – both of which we expect – we believe that forecast is realistic, and the Fed could begin cutting rates at its March meeting.
Risks to this outcome include ongoing high inflation, potentially due to disruption of oil supplies and trade routes arising from the conflicts in the Middle East and Ukraine. Persistent wage gains could also lead the Fed to keep rates higher for longer, since softening in the labor market may be necessary to bring inflation to the Fed’s 2% target rate.
GDP growth should moderate but remain positive. We expect the housing sector to improve and contribute to GDP growth as mortgage interest rates decline, making homes more affordable for buyers and causing reluctant homeowners, who currently have mortgages at much lower rates, to finally list their homes for sale.
As companies begin to report fourth quarter 2023 financial results, we believe earnings will rise for the second straight quarter. The current consensus forecast is for an increase of 1.3%, and we expect actual results to be slightly higher. We also forecast an increase in earnings throughout the year as the growth of the U.S. economy slows.
After the runup in prices in late 2023, the S&P 500 index is trading near an all-time high and at a multiple of earnings that is above historical averages (currently 19.2 times expected earnings for the next twelve months versus an average multiple of 18.9 times over the past five years). By most measures, the market is still slightly less pricey than it was at its peak in January 2022, yet returns in the short term may be limited. The upcoming presidential election will grab headlines and provide uncertainty during the year, creating market jitters along the way. Regardless, we believe that the prospects of ongoing economic growth, lower interest rates, and increased corporate earnings will provide attractive returns over the longer term.
With interest rates still high, we continue to hold bonds in the income allocations of our portfolios. We are closely monitoring interest rates and may lengthen the duration of the bonds we purchase or ultimately reduce our bond purchases if rates decline significantly, turning instead to other opportunities for income that may become more appealing.
Further Analysis of Stock and Bond Markets
Source: YCharts
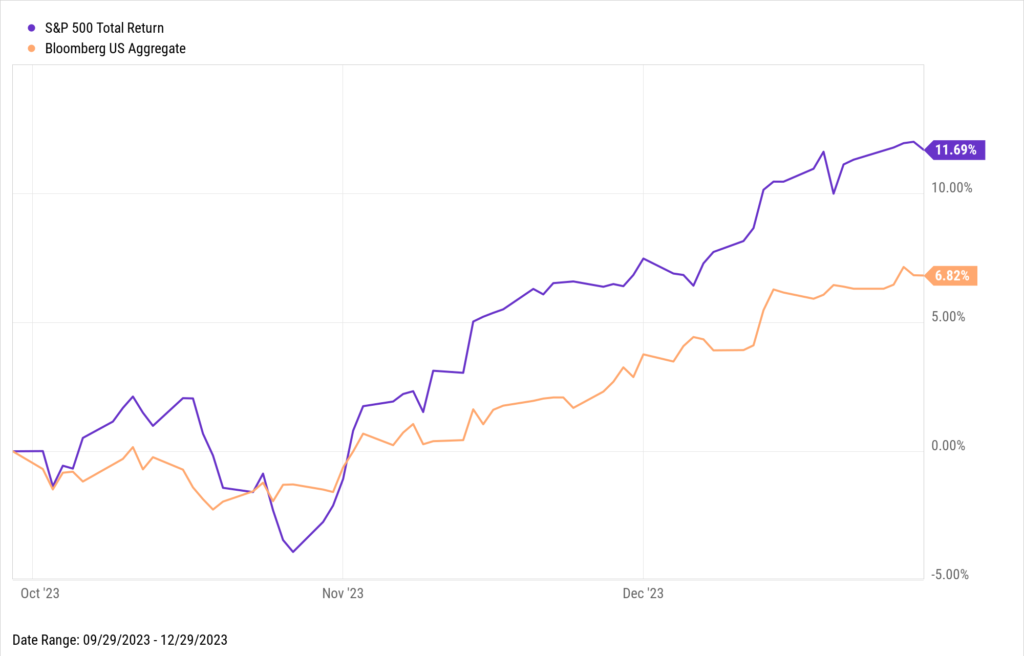
Stocks and bonds declined in tandem during the beginning of the fourth quarter, as Treasury yields peaked in late October over fears that the Fed would keep rates higher for longer. These fears quickly eased, however, and stocks and bonds both rallied to finish the year at new highs after economic reports showed inflation continued to slow and the Fed released projections with a median consensus for three rate cuts during 2024. Investors cheered the possibility of easier monetary policy and took the potential rate cuts as a sign the Fed was gaining confidence in its fight against inflation.
Source: YCharts
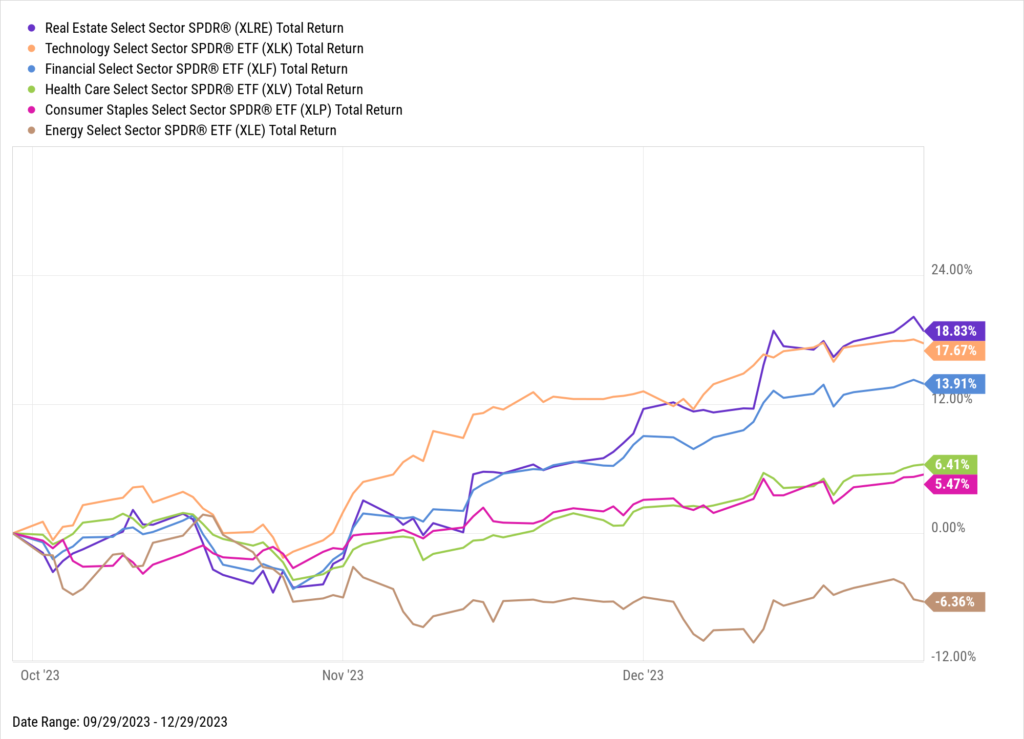
The stock market rally during the fourth quarter was broad and extended to ten of the eleven sectors in the S&P 500 index. Real estate and financials were two of the best performing sectors during the fourth quarter, an indication that investor optimism was spreading to sectors beyond technology. Stocks in both sectors rebounded sharply on hopes for easing financial conditions after a challenging start to the year that saw a regional banking crisis and increased stress on commercial real estate from weak demand for office space as a result of remote work schedules. The only sector that was negative during the fourth quarter was energy, as oil prices slid due to mounting worries about global fuel demand.
Source: YCharts
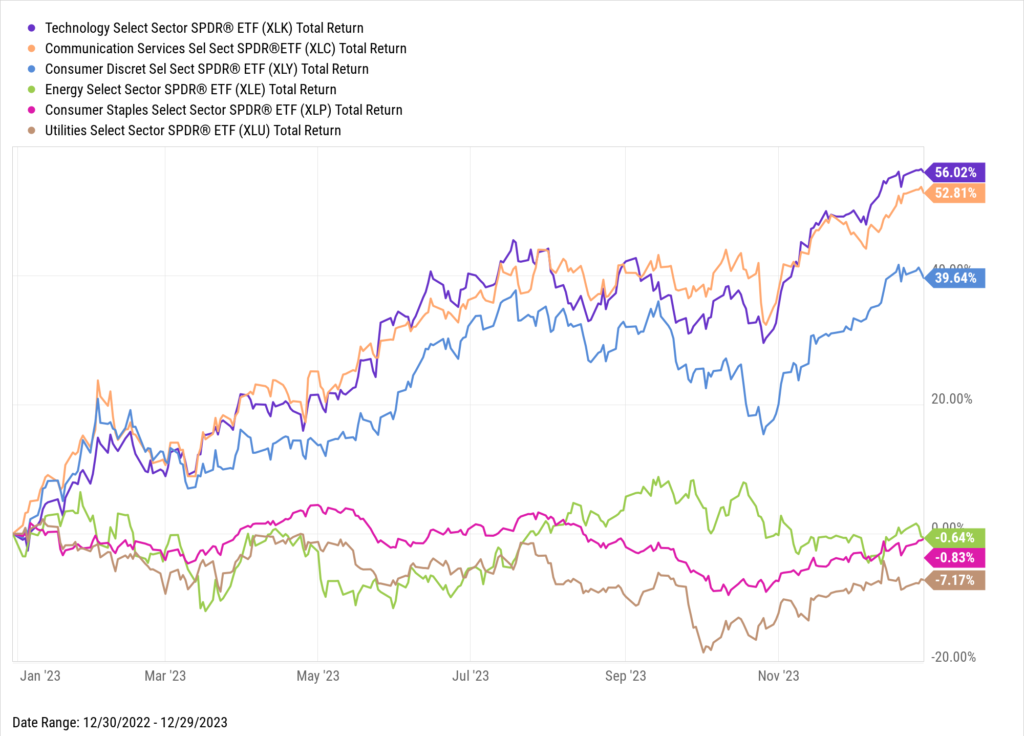
For the full year, the top three performing sectors were technology, communication services, and consumer discretionary. These sectors, which contain more growth stocks, continued their march higher on renewed hopes of rate cuts after having benefited from strong consumer spending and optimism surrounding artificial intelligence during the year.
The bottom three performing sectors for the full year were energy, consumer staples, and utilities. The energy sector’s flat performance for the year mirrored Brent crude oil prices, which ended the year at $78 per barrel, $4 lower than at the start of 2023. Stocks in the consumer staples and utilities sectors are usually considered defensive given their lower sensitivity to economic cycles. 2023 marked a reversal compared to 2022, when investors flocked to these sectors for protection during the market downturn.
Source: YCharts
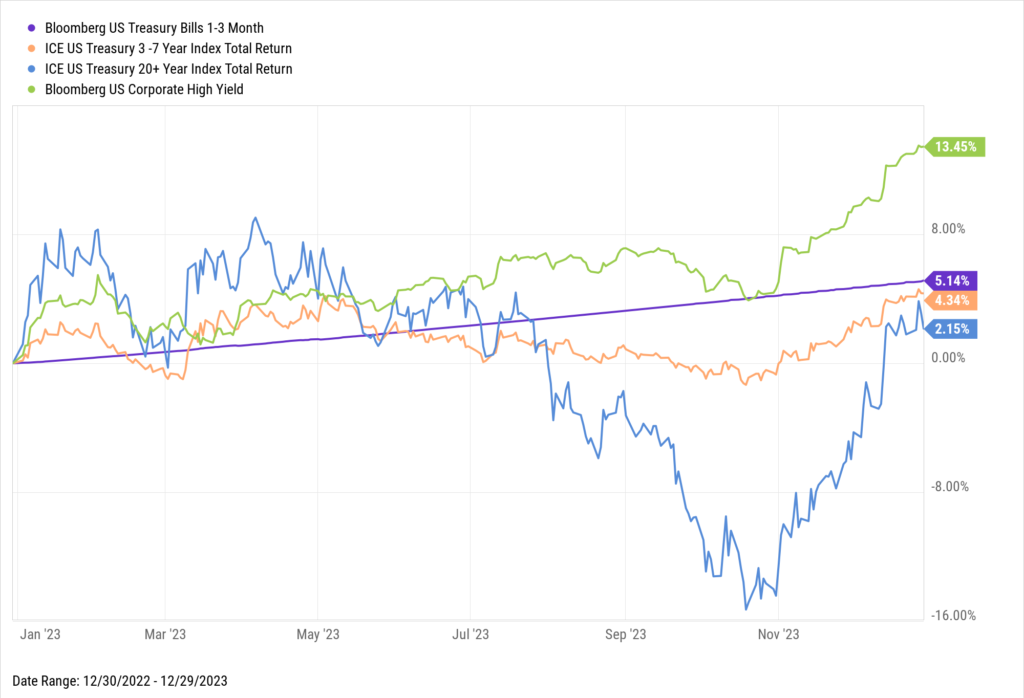
Expectations for rate cuts in 2024 sent long-term bond prices higher during the fourth quarter. However, the rebound in prices was not enough to beat out the return of short-term bonds for the full year. The yield curve remains inverted, an uncommon condition in which short-term yields are higher than long-term yields, continuing to reward investors in short-term bonds.
High yield bonds continued their impressive performance, delivering double-digit returns that most investors have recently associated only with stocks. Investors benefited from higher yields as the U.S. economy remained resilient and default rates remained subdued
Disclosures
This material represents an assessment of the market and economic environment at a specific point in time and is not intended to be a forecast of future events, or a guarantee of future results. Forward-looking statements are subject to certain risks and uncertainties. Actual results, performance, or achievements may differ materially from those expressed or implied. Information is based on data gathered from what we believe are reliable sources. It is not guaranteed as to accuracy, does not purport to be complete and is not intended to be used as a primary basis for investment decisions. It should also not be construed as advice meeting the particular investment needs of any investor. Past performance does not guarantee future results.
Indices are unmanaged and investors cannot invest directly in an index. Unless otherwise noted, performance of indices does not account for any fees, commissions or other expenses that would be incurred. Returns do not include reinvested dividends.
The Standard & Poor’s 500 (S&P 500) Index is a free-float weighted index that tracks the 500 most widely held stocks on the NYSE or NASDAQ and is representative of the stock market in general. It is a market value weighted index with each stock’s weight in the index proportionate to its market value.
The Bloomberg Barclays US Aggregate Bond Index, or the Agg, is a broad base, market capitalization-weighted bond market index representing intermediate term investment grade bonds traded in the United States. Investors frequently use the index as a stand-in for measuring the performance of the US bond market.
The Consumer Price Index (CPI) is a measure of inflation compiled by the US Bureau of Labor Studies.
The PCE price index (PCEPI), also referred to as the PCE deflator, PCE price deflator, or the Implicit Price Deflator for Personal Consumption Expenditures (IPD for PCE) by the BEA, and as the Chain-type Price Index for Personal Consumption Expenditures (CTPIPCE) by the Federal Open Market Committee (FOMC), is a United States-wide indicator of the average increase in prices for all domestic personal consumption. It is benchmarked to a base of 2012 = 100. Using a variety of data including U.S. Consumer Price Index and Producer Price Index prices, it is derived from the largest component of the GDP in the BEA’s National Income and Product Accounts, personal consumption expenditures.
Exchange Traded Funds (ETF’s) are sold by prospectus. Please consider the investment objectives, risks, charges, and expenses carefully before investing. The prospectus, which contains this and other information about the investment company, can be obtained from the Fund Company or your financial professional. Be sure to read the prospectus carefully before deciding whether to invest.