Quarterly View: October 2024
Oct 14, 2024- Stocks continued to climb in the third quarter, with the S&P 500 rising 5.9%, including dividends, for a year-to-date gain of 22.1%.
- Performance broadened during the quarter with more stocks and sectors participating in the market’s gains, especially those sensitive to interest rate changes, while technology stocks lagged the overall market.
- The Federal Reserve started the cycle of easing interest rates in September with a half-percentage-point reduction in the Fed funds rate.
- The Fed’s decision on a bigger rate cut was informed by steady improvement in lowering inflation and an increase in the unemployment rate this summer.
- We remain optimistic about economic growth and opportunities for further stock market gains in the final quarter, particularly after the uncertainty of the presidential election outcome is behind us.
A Bigger Rate Cut Boosts Markets
Stocks continued to ascend to record highs during the third quarter, largely in anticipation of the beginning of monetary policy easing from the Federal Reserve. The Fed eventually delivered on those expectations at the September Federal Open Market Committee (FOMC) meeting with a half-percentage-point rate cut—something that didn’t seem likely until reports of falling inflation and rising unemployment spurred members of the Fed’s rate-setting committee to take this more dramatic action. In a positive sign for diversified investors, more stocks and market sectors participated in this quarter’s rally and returns were less dependent on the handful of technology heavyweights that powered gains in the first half of the year.
We remain optimistic about the economy and the markets as we head into the final quarter of the year. With the Fed just starting on the path toward lower interest rates, there is increasing likelihood that the U.S. economy can avoid recession, although some slowdown in economic growth should be expected. Inflation is moving in the right direction and the outlook for corporate earnings appears strong; both factors should support continued growth in the economy and financial markets. The outcome of the presidential election is a big unknown right now, but once we are past that event the removal of uncertainty should also aid the market.
Third Quarter Review
The S&P 500 rose 5.9% in the third quarter, overcoming a temporary dip during the summer. Year to date, the benchmark U.S. stock index has achieved an impressive gain of over 22%. But it wasn’t business as usual for stocks this quarter; technology stocks didn’t carry the weight of performance as they did in the first half of the year, and returns broadened into other sectors and other stocks. Technology company stocks mostly stalled out in the third quarter as investors began to scrutinize these companies’ increased spending on artificial intelligence (AI).
What stocks benefited from the shift in market momentum? Among large-capitalization sectors, financials and industrials were the biggest contributors to the S&P 500’s quarterly returns, and utilities and real estate also outperformed the index. Beyond large caps, small-company and international stocks returned to favor, after a long period of dragging on portfolio performance. It is important to note that international stock indexes have lower weightings in technology than the S&P 500, so the broadening of performance away from tech stocks helped relative returns. Small capitalization stocks rallied on growing expectations for lower interest rates; smaller firms tend to be more reliant on borrowing, so lower rates should contribute to better earnings for many of these companies.
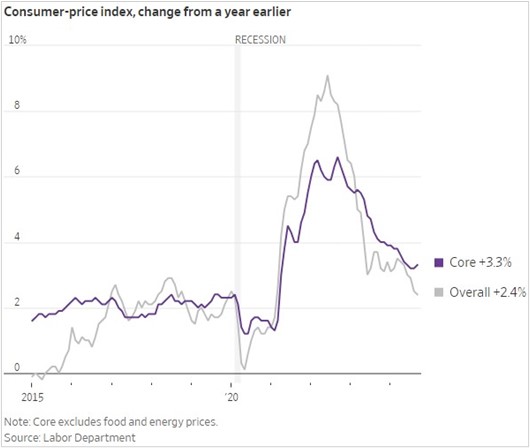
The Federal Reserve eventually delivered its much-anticipated interest rate cut, lowering the Fed funds target rate by a half-percentage point at the September FOMC meeting. In statements leading up to this meeting, Fed chair Jerome Powell and other central bank officials had primed the markets for a smaller quarter-point cut, but the evolving economic picture convinced them (and the markets in the days leading up to the September meeting) that a bigger move was warranted. For one, inflation had shown considerable improvement throughout the summer, falling to a year-over-year rate of 2.5% in August and, after the Fed meeting, to 2.4% in September. The rapid shift in consumer price growth showed that the Fed’s aggressive rate-tightening approach was having its intended effect. Secondly, changes in the labor market over the summer gave the Fed new data to consider, including a rising unemployment rate and softer job growth.
The latest employment report for September (released in early October) showed a more resilient labor market; job creation bounced back, and the unemployment rate eased a bit. This data could explain why we have not yet seen any cascading negative effect on consumer spending, or by extension U.S. economic growth. Retail sales have remained positive this summer, and consumer sentiment as surveyed by the University of Michigan is at a five-month high as of September.
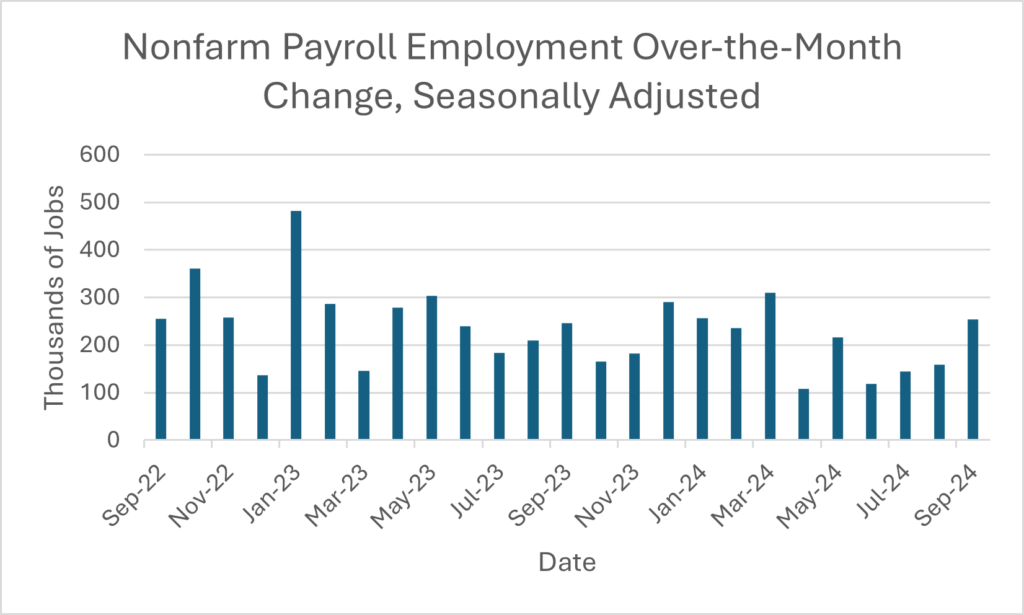
Source: Bureau of Labor Statistics
The resilience of the jobs market and consumer spending has helped sustain corporate earnings growth at a steady rate. Earnings growth for S&P 500 companies in the second quarter (reported in the third quarter) came in at a 11.3% year-over-year rate, according to FactSet, the highest pace of growth in nearly three years. Moreover, 80% of S&P 500 firms beat estimates for second-quarter earnings, slightly higher than the long-term average, but the size of the earnings beats was generally smaller than average.
Outlook
Looking ahead to the final quarter of 2024, we continue to maintain a favorable outlook for positive stock returns. The Federal Reserve is just at the start of this rate-easing cycle, and more rate cuts are likely to come at the last FOMC meetings of the year. Further Fed easing should help the U.S. economy stay in expansion mode and avoid recession. Inflation is declining, which offers some relief to budget-stretched consumers and should help sustain spending. Corporate earnings strength should also help support ongoing economic growth and market returns. The labor market bears watching to see whether last month’s resilience was temporary or if the improvement in the unemployment rate can be sustained.
With more Fed rate cuts all but locked in, the big uncertainty for investors for the fourth quarter will be the presidential election, and this campaign season has already had its share of surprises. Much like the previous presidential elections, this one is set to come down to the wire. We may not even know the outcome for several weeks or months after Election Day, as votes in tight races are counted closely and results are likely contested in the courts.
It may sound like the markets are set up for increased volatility, and we may see some short-term reactions in stocks as events unfold, including the impact of major hurricanes on regional economies. However, times of uncertainty like these can lead investors to make financial decisions that are contrary to their long-term plans.
In particular, we advise our clients (and all investors generally) not to get too anxious about the effect of the election on the economy or the financial markets. History has proven that the outcome of past presidential elections has not significantly impacted long-term financial trends—we wrote about this non-impact in an August blog article. When it comes to market performance, there are more important factors to consider, including economic fundamentals and the bottom-line performance of businesses.
The market has demonstrated resilience and growth over extended periods of time. We believe the best way for investors to participate in that resilience and growth is to have financial plans and diversified portfolios that are suited for their goals and risk tolerance and monitored regularly to meet those objectives.
Further Analysis of Stock and Bond Markets
The gap in performance between the S&P 500 Index and its equal-weight counterpart narrowed during the third quarter with the broadening of the market rally. However, the year-to-date S&P 500 return of 22.1%, including dividends, continued to outpace the 15.2% return of the S&P 500 Equal Weight Index. That performance gap was fueled by the outsized influence of a few large cap tech stocks: Microsoft, Apple, NVIDIA, Amazon and Meta Platforms together contributed roughly 40% of the S&P 500’s year-to-date return.
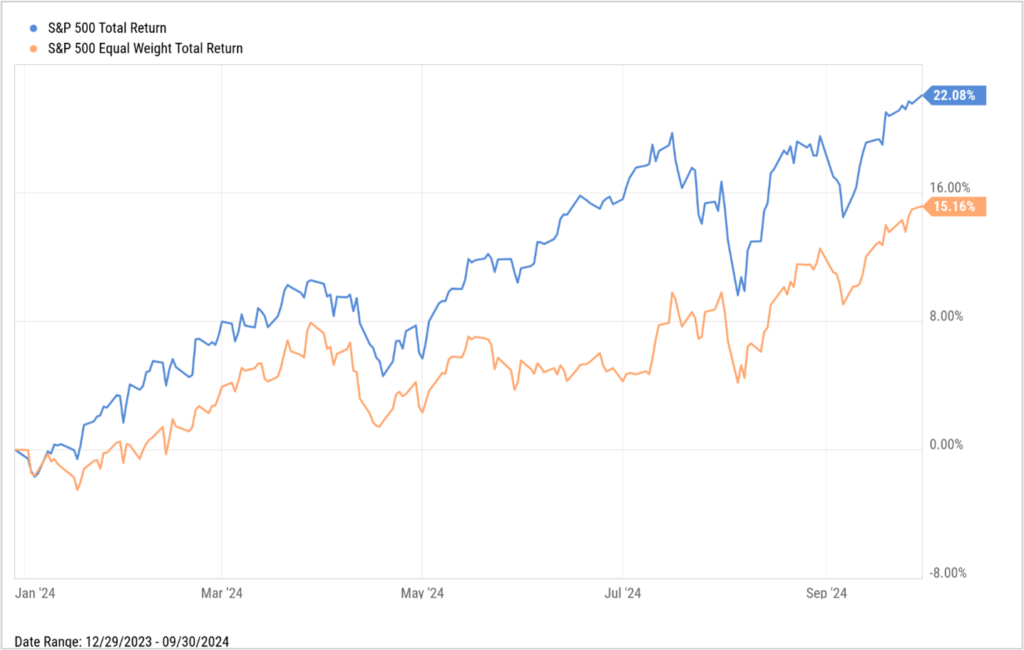
Source: YCharts
Through September, all eleven sectors in the S&P 500 were positive for the year to date, with technology and utilities leading the pack. Utility stocks have become new beneficiaries of the technology sector’s rapid investment in artificial intelligence, as power-hungry data centers seek more electricity to run the computations needed for AI models. Many large tech companies are also looking to expand their use of renewable energy solutions, such as nuclear, to power their artificial-intelligence products. Consumer discretionary and energy were the two worst-performing sectors for the S&P 500 for the year to date. Consumer discretionary stocks were pressured by fears of a slowing labor market and stretched consumers who are still facing high borrowing costs. Energy stocks have been pressured by flat oil prices throughout the year.
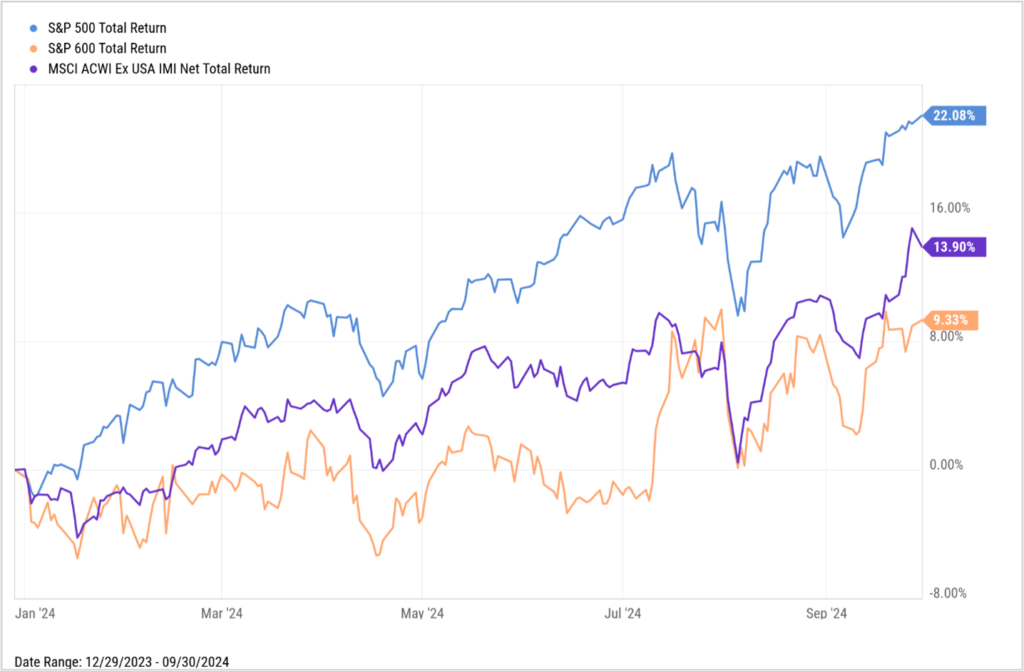
Source: YCharts
Small-capitalization stocks rallied during the third quarter on the news of lower inflation and the start of a new Fed rate cutting cycle. However, small caps continued to underperform relative to large-cap stocks, with the S&P SmallCap 600 Index returning 9.3%, including dividends, for the year to date. International stocks, as measured by the MSCI All Country World Index (ACWI) ex-USA, continued to lag the S&P 500 for the year to date as well. News of economic stimulus in China gave a boost to emerging market stocks late in the third quarter, although this support was offset by fears of a slowdown in the eurozone.
Source: YCharts
The Fed lowered interest rates by a half-percentage-point at its September meeting, higher than its typical policy adjustment of quarter-point increments. Most investors saw this rate cut as a kick-off to a new rate cutting cycle as the Fed gains confidence in its fight against inflation and shifts its focus to supporting the labor market. Also at its September meeting, the Fed released projections for two more quarter-point cuts by year end, which would bring the Fed funds target range to 4.25%-4.50%.
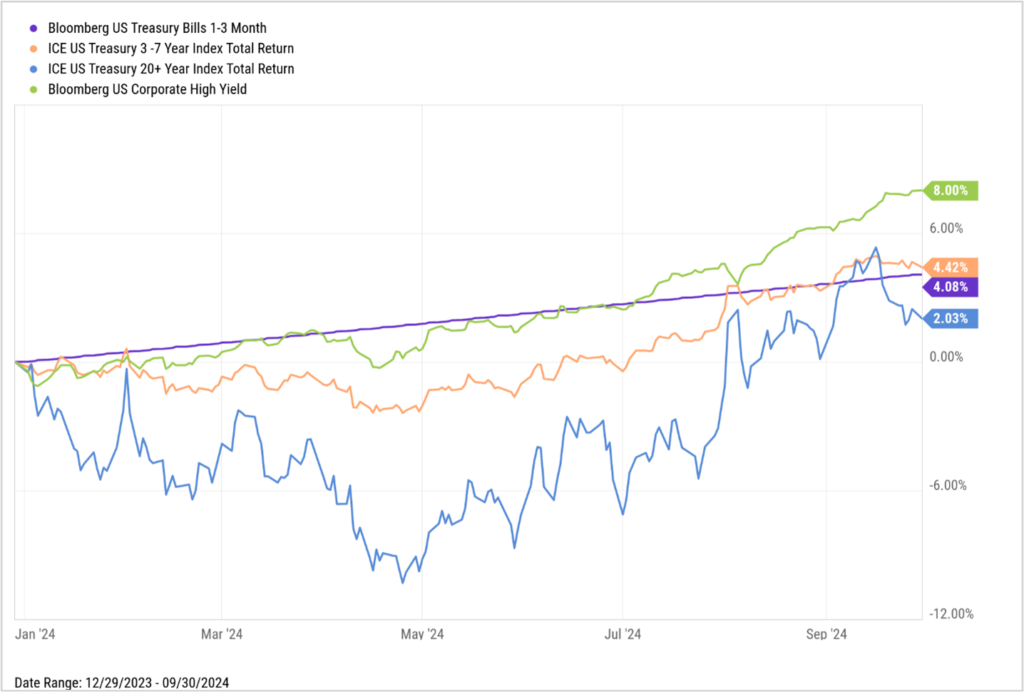
Accordingly, bond prices rose during the third quarter, with some longer-term bond returns inching ahead of short-term 1-3-month Treasury bill returns for the year to date. While we believe longer duration bonds should benefit from the Fed’s rate cuts as investors are faced with declining yields on shorter-term bills, we expect continued volatility in bond prices as investors try to discern the longer-term path of interest rates in light of a resilient economy that continues to defy growth expectations. With the probability of a recession remaining low, riskier and higher-yielding corporate bonds have continued to outperform U.S. Treasuries during the year.
Security Highlight: HCA Healthcare, Inc. (HCA)
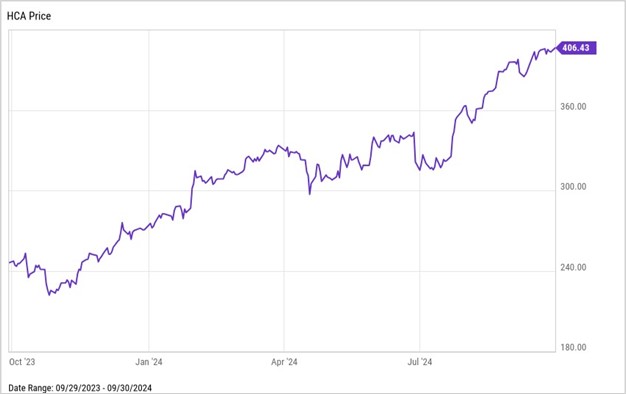
Price (9/30/2024): $406.43 Forward P/E: 16.1
Market Cap ($B): $105 Price/Book: NM
Dividend Yield: 0.7% Price/ Sales: 1.5
Return on Equity: NM Debt/Equity: NM
Sources: Morningstar, YCharts
HCA Healthcare, Inc., headquartered in Nashville, Tennessee, is one of the largest for-profit healthcare providers in the United States. As of June 30, 2024, the company operated 188 hospitals, 123 freestanding surgery centers, and 23 freestanding endoscopy centers across 20 U.S. states and the United Kingdom, with almost 50,000 licensed beds.
Operating in a growing healthcare sector driven by an aging population and increasing prevalence of chronic conditions, HCA Healthcare stands to benefit from rising demand for medical services. The company’s extensive network provides significant competitive advantages, such as operational efficiencies, cost savings, and strong bargaining power with suppliers and insurers. By investing in advanced medical technologies, strategic acquisitions, facility upgrades, and workforce development, HCA can enhance its reputation and patient outcomes while capitalizing on increased patient volumes and the resumption of elective procedures post-pandemic. Additionally, the company is enhancing its digital capabilities, including electronic health records and telemedicine services, to improve patient engagement and streamline operations.
Although rising labor costs for healthcare workers and evolving healthcare policies and regulations will continue to be challenges for HCA, we believe the company’s focus on operational efficiencies and innovation contribute to a competitive moat which should allow HCA to expand its market share despite competition from other large healthcare systems and regional providers.
We like that HCA has been able to maintain healthy operating margins over the past few years and has generated stable cash flows to support its ongoing investments in growth initiatives and shareholder returns. Management is committed to returning capital to shareholders in the form of both share buybacks and dividends, as evidenced by last year’s $7 billion in share buybacks on top of $2.64 per-share in dividends paid over the past year. We view the company’s shares as attractively valued based on a price-to-earnings (P/E) ratio of 16 times forward earnings, which is above HCA’s five-year average ratio of 13, but below the P/E of most healthcare peers and the S&P 500’s forward price-to-earnings ratio of 21.
Security Highlight: UnitedHealth Group Inc. (UNH)
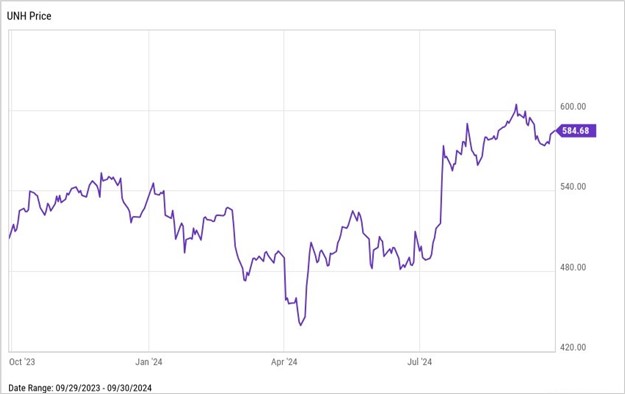
Price (9/30/2024): $584.68 Forward P/E: 18.5
Market Cap ($B): $540 Price/Book: 6.0
Dividend Yield: 1.4% Price/ Sales: 1.4
Return on Equity: 28.5% Debt/Equity: 0.8
Sources: Morningstar, YCharts
UnitedHealth Group, headquartered in Minnetonka, Minnesota, is the largest publicly-traded managed care company in the United States by revenue. The company operates through two main segments: UnitedHealthcare and Optum. UnitedHealthcare, accounting for approximately 55% of the company’s revenue, provides health insurance and benefit plans and is one of the largest providers of Medicare Advantage, Medicare Part D, and commercial health insurance plans. Optum, contributing the other 45% of revenue, offers healthcare services, technology, and pharmacy benefits management. Comprising OptumHealth, OptumInsight, and OptumRx—one of the largest pharmacy benefit managers in the country—Optum is the company’s faster-growing segment, focusing on leveraging data and technology to improve healthcare delivery.
UnitedHealth Group holds a strong position in the managed care industry by leveraging its extensive membership base to negotiate favorable terms with providers, thereby reducing costs and improving profit margins. The integration of UnitedHealthcare and Optum allows UnitedHealth Group to offer comprehensive healthcare solutions supported by significant investments in technology and data analytics.
The company is well-positioned to capitalize on several growth opportunities, such as an aging population and the increasing demand for healthcare services, particularly in Medicare Advantage plans. The acquisition of Change Healthcare in 2022 enhanced Optum’s capabilities in data analytics and technology solutions, although a cyberattack at Change Healthcare in February made headlines and pressured UnitedHealth Group’s shares earlier this year. Optum continues to expand its focus on innovative solutions in pharmacy care services, care delivery, and international markets, benefiting from the industry’s shift toward value-based care models. UnitedHealth expects OptumHealth to serve an additional 750,000 patients in value-based arrangements in 2024.
Despite the challenges related to the Change Healthcare cyberattack, UnitedHealth Group demonstrated continued growth in the first half of 2024, with revenues increasing over 7% year-over-year. We believe UnitedHealth Group should continue to have attractive long-term prospects as one of the largest providers in the healthcare industry and think shares are attractively priced, currently trading at a slight discount to their five-year average price-to-earnings ratio of 19 times forward earnings.
Disclosures
This material represents an assessment of the market and economic environment at a specific point in time and is not intended to be a forecast of future events, or a guarantee of future results. Forward-looking statements are subject to certain risks and uncertainties. Actual results, performance, or achievements may differ materially from those expressed or implied. Information is based on data gathered from what we believe are reliable sources. It is not guaranteed as to accuracy, does not purport to be complete and is not intended to be used as a primary basis for investment decisions. It should also not be construed as advice meeting the particular investment needs of any investor. Past performance does not guarantee future results.
Diversification does not guarantee a profit or protect against a loss in a declining market. It is a method used to help manage investment risk.
Indices are unmanaged and investors cannot invest directly in an index. Unless otherwise noted, performance of indices does not account for any fees, commissions or other expenses that would be incurred. Returns do not include reinvested dividends.
The Standard & Poor’s 500 (S&P 500) Index is a free-float weighted index that tracks the 500 most widely held stocks on the NYSE or NASDAQ and is representative of the stock market in general. It is a market value weighted index with each stock’s weight in the index proportionate to its market value.
The Standard & Poor’s 500 Total Return Index (SPTR) is an unmanaged group of securities considered to be representative of the stock market that tracks capital appreciation as well as distributions. It is a market value weighted index with each stock’s weight in the index proportionate to its market value. The Total Return index assumes that all cash distributions (dividends and/or interest) are reinvested.
The S&P 500 Equal Weight Index provides exposure to the largest 500 public U.S. companies in the S&P 500 Index (a market value weighted index). However, each company is weighted at 0.2%, to provide more diversification and less concentration.
The S&P SmallCap 600 seeks to measure the small-cap segment of the U.S. equity market. The index is designed to track companies that meet specific inclusion criteria to ensure that they are liquid and financially viable.
Smaller capitalization securities involve greater issuer risk than larger capitalization securities, and the markets for such securities may be more volatile and less liquid. Specifically, small capitalization companies may be subject to more volatile market movements than securities of larger, more established companies, both because the securities typically are traded in lower volume and because the issuers typically are more subject to changes in earnings and prospects.
Securities of small and medium-sized companies tend to be riskier than those of larger companies. Compared to large companies, small and medium-sized companies may face greater business risks because they lack the management depth or experience, financial resources, product diversification or competitive strengths of larger companies, and they may be more adversely affected by poor economic conditions. There may be less publicly available information about smaller companies than larger companies. In addition, these companies may have been recently organized and may have little or no track record of success.
The Nasdaq Composite Index is a market-capitalization weighted index of the more than 3,000 common equities listed on the Nasdaq stock exchange. The types of securities in the index include American depositary receipts, common stocks, real estate investment trusts (REITs) and tracking stocks. The index includes all Nasdaq listed stocks that are not derivatives, preferred shares, funds, exchange-traded funds (ETFs) or debentures.
The Consumer Price Index (CPI) is a measure of inflation compiled by the US Bureau of Labor Studies.
Nothing contained herein is to be considered a solicitation, research material, an investment recommendation or advice of any kind. The information contained herein may contain information that is subject to change without notice. Any investments or strategies referenced herein do not take into account the investment objectives, financial situation or particular needs of any specific person. Product suitability must be independently determined for each individual investor. Glassy Mountain Advisors explicitly disclaims any responsibility for product suitability or suitability determinations related to individual investors. This information does not constitute an offer to sell or a solicitation of an offer to buy securities, nor shall there be any sale of securities, in any state or jurisdiction in which such an offer, solicitation or sale would be unlawful.
The MSCI ACWI ex USA Investable Market Index (IMI) includes large, mid and small cap companies and targets coverage of approximately 99% of the global equity opportunity set outside the US. The MSCI ACWI ex USA Index captures large and mid cap representation across 22 of 23 Developed Markets (DM) countries (excluding the United States) and 24 Emerging Markets (EM) countries*. The index targets coverage of approximately 85% of the global equity opportunity set outside the US.


