Quarterly View: July 2023
Jul 11, 2023Persistence and Resilience
The U.S. stock market continued to climb in the second quarter of 2023, prevailing in the face of challenges including persistent inflation, fears of recession, and the war in Ukraine. Despite higher interest rates resulting from the U.S. Federal Reserve’s efforts to reduce inflation, the economy has remained strong and consumer confidence is still high.
As we enter the second quarter earnings season, analysts expect corporate earnings to decline, but they still forecast a slight increase in earnings for 2023. Valuation measures, such as the price-to-earnings ratio (P/E), are higher than they were at the end of the last quarter, and we think stocks will remain around current levels in the coming months as investors consider earnings and economic reports.
Second Quarter Review
The S&P 500 index rose 8.7%, including dividends, in the second quarter and was up 16.9% for the first half of 2023. Technology stocks led the way again, with the best performances concentrated in several of the largest tech companies. The Nasdaq Composite Index[i] has risen 32% in 2023, after lagging the broad market last year. U.S. stocks continued to perform better than most foreign stocks, and small capitalization stocks recently surged on signs of economic strength. Stock market volatility declined to pre-pandemic levels, though there was a wide dispersion of returns between the best and worst performers. The yield on the 10-Year Treasury rose and is currently 3.8%, compared to 3% percent a year ago.
Entering this year, the Fed’s commitment to reduce inflation by raising interest rates had many worried that the U.S. economy could fall into a recession. By most measures, however, the economy remains strong, and recession fears are easing. First quarter GDP increased 2%, and the June jobs report showed that hiring is slowing yet still robust. Even though the 209,000 jobs added was the smallest gain since December 2020, the increase reflects the 30th consecutive month of jobs increases and is unlikely to prevent the Fed from raising rates again at its next meeting, particularly since wage gains were again strong. The unemployment rate ticked down slightly to 3.6% in June, matching the average over the past 12 months.
Consumer confidence soared in June to its highest level since January 2022, an indication that consumer spending will likely remain strong despite cooling a bit in May. Durable goods orders have increased for three straight months, a sign of health in the manufacturing sector, though the Manufacturing PMI®[ii], another key reading of manufacturing sector health, showed weakness. The real estate sector is also mixed. Home prices are ticking back up largely due to constrained inventory as homeowners with low-rate mortgages have been reluctant to sell. In contrast, commercial real estate is troubled, particularly in downtown areas hard hit by the trend towards remote work.
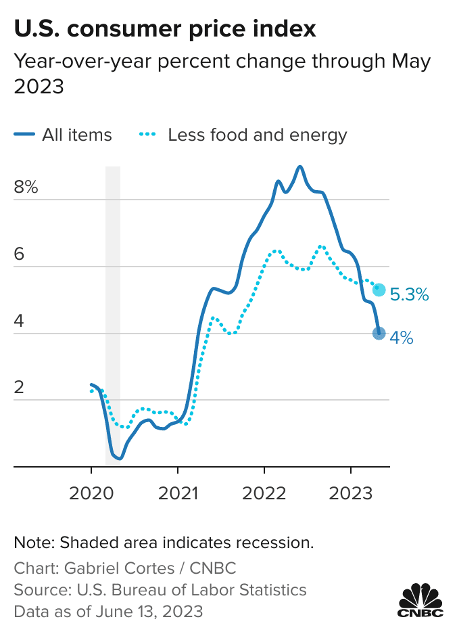
The Consumer Price Index[iii] in the United States, most recently 4% for the past year, has fallen steadily to less than half the rate a year ago. However, core inflation, which excludes food and energy, has declined less and remains at 5.3% over the past year. After seeing some improvement and hoping to get a better gauge of the full effects of past interest rate increases, the Fed held rates steady at its most recent meeting in June. Fortunately, the political battle over the debt ceiling resolved before severely damaging the economy, though political dysfunction still hangs over the markets as an ongoing risk.
Foreign economies showed some weakness. War continued in Ukraine and contributed to inflation in Europe, which is running higher than in the United States. The European Central Bank continued to raise interest rates to fight inflation and seems unlikely to pause soon. After starting to rebound from the pandemic, China’s economic growth slowed recently due to weakening consumer confidence and slumping real estate investment.
Outlook
Following a very strong start in the first half of the year, stocks may hover around current levels as the economic picture and earnings outlooks become clearer. The performance of the largest tech companies, whose stocks have accounted for much of the gains so far this year and are heavily weighted in the S&P 500 index, will be critical to the broader market’s performance. We are optimistic the Fed may succeed in its efforts to quell inflation without sending the economy into recession, but challenges still linger.
As companies report earnings for the second quarter, investors will be closely watching for signs of weakening consumer spending after broad price increases by businesses trying to boost profit margins. Current expectations are for a 7.2% decline in S&P 500 index companies’ earnings, which would mark the third consecutive quarterly drop. However, analysts expect earnings growth to pick up in the second half of the year, leading to a slight increase for the full year.
Given its target inflation rate of 2%, the Fed is likely to raise rates further, but we believe the Fed is nearing the end of the rate hiking cycle and are optimistic that the U.S. economy will avoid a recession. The European Central Bank will most likely continue boosting interest rates; combined with the ongoing war in Ukraine, these actions will probably dampen economic growth in the Eurozone.
The S&P 500 index is currently trading for about 19 times estimated earnings for the next year, slightly above the index’s five-year average of 18.6 times. We expect investors to be more cautious as they wait to see earnings results, and we remain optimistic that patient investors will still enjoy attractive returns over the long term even after the recent rise.
We continue to favor bonds in our income allocations, though we still like certain equities with higher yields. With short-term interest rates around 5%, we are happy to own more short-term bonds and are trying to limit our exposure to interest rate risk. Even cash in money market funds is yielding 4.5%-5%, a level that we have not seen in many years.
Analysis of Selected Securities[iv]
The following is a discussion of several securities we own and have bought recently. Due to factors specific to each company, these securities are, in our opinion, priced attractively in the markets today.
Adobe Inc. (ADBE)
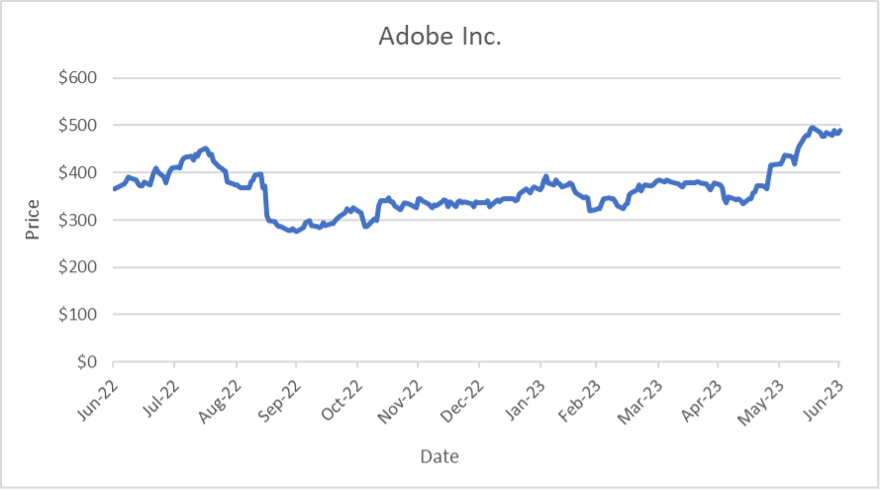
Price (June 30 ’23): $488.99 Forward P/E: 30.7
Market Cap ($B): $221.2 Price/Book: 14.8
Dividend Yield: 0.0% Price/Sales: 12.1
Return on Equity: 33.7% Debt/Equity: 0.3
Sources: Morningstar, YCharts
Adobe Inc. is the largest provider of content creation software for creative professionals and consumers. Approximately three-quarters of the company’s revenue comes from its digital media segment, which includes its flagship photo editing software Photoshop, drawing software Illustrator, and video editing software Premiere Pro. The other quarter of Adobe’s revenue comes from its digital experience, publishing, and advertising segments, which offer digital marketing analytics, marketing campaign management, and customer engagement tools and services.
Since its introduction in 1989, Photoshop has become the industry standard for image editing software. Additionally, Adobe pioneered the pdf file format, allowing it to deliver fully digital document solutions. The rise of computers, smartphones, and tablets has made the pdf file format, which is usable on any screen, an important differentiator for Adobe. The rapid adoption of Photoshop with creative professionals and Adobe’s ability to continue adding new products and features to its suite of products have allowed Adobe to develop the most comprehensive portfolio of solutions used in print, digital, and video content creation.
In September 2022, Adobe announced the acquisition of collaborative design company, Figma, for approximately $20 billion, marking the largest acquisition ever for Adobe. Although management believes the acquisition makes sense strategically, the announcement sent shares down sharply as many investors balked at the high purchase price. The acquisition is currently under review by various regulatory bodies around the world, and management hopes to close the deal by the end of this year.
Shares have rallied recently from their September lows due to renewed investor optimism regarding artificial intelligence and Adobe’s ability to capitalize on this trend. This past March, Adobe launched a new website, Firefly, to demonstrate its artificial intelligence tools. Firefly allows users to generate images, audio, and videos from text prompts. Since Firefly was launched in March, Adobe reported that users have created over 500 million generations, with creation from Photoshop being much higher than management had projected. Adobe plans to offer subscriptions to users in the future, and the market reaction has already been overwhelmingly positive as adding artificial intelligence capabilities throughout Adobe’s portfolio is seen as a significant development that should boost efficiency and allow users to accomplish more with Adobe’s products.
Despite the recent rally in share price, Adobe shares trade at a price to forward earnings multiple of 30.7 times, which is below their historical five-year average multiple of 35 times. Adobe has historically maintained a conservative balance sheet, and the company generates ample free cash flow to fund growth, execute its acquisition strategy, and return capital to shareholders via share buybacks. We remain optimistic that Adobe can continue to benefit from the long-term trends in digital media and attract new users as it integrates new technologies, such as artificial intelligence, into its existing products.
Applied Materials, Inc. (AMAT)

Price (June 30 ’23): $144.54 Forward P/E: 19.5
Market Cap ($B): $117.2 Price/Book: 8.3
Dividend Yield: 0.9% Price/Sales: 4.5
Return on Equity: 50.5% Debt/Equity: 0.4
Sources: Morningstar, YCharts
Applied Materials, headquartered in Santa Clara, California, is the world’s largest supplier of equipment, services, and software to the semiconductor, display, and related industries, with operations spanning over 60 countries. The company’s diverse range of products and services and its development and use of emerging technologies have been key in preserving its leadership position in this expanding market. Applied Materials has the financial capacity to continually innovate through research and development and meet the needs of customers at every phase of the semiconductor manufacturing process.
Applied Materials boasts the most extensive product portfolio in the industry, providing a one-stop solution for customer equipment needs. As the technical complexity of semiconductor manufacturing escalates, collaboration between Applied Materials and its customers should increase even further as customers participate more and more in the early stages of next-generation technology development. Applied Materials has increased market share with its customers while maintaining high margins and strong cash flows through strategic capital investments.
We expect the semiconductor industry to continue to expand, partly from the focus on artificial intelligence and demand for next generation chips, and Applied Materials is strategically aligned to profit from this upswing. Management has displayed confidence in the business, announcing a dividend increase of over 20% compared to last year and authorizing an additional $10 billion for share repurchases. Management highlighted that the entire dividend can now be supported by cash flow stemming from the tremendous growth in the company’s services segment, which has been notably stable through chip sales cycles.
The company’s shares are currently valued at 19.5 times projected earnings for the next year, higher than their five-year average of 15 times yet roughly the same as the industry average and the S&P 500 index. Even after the recent surge in price due to investor optimism surrounding artificial intelligence, we continue to view shares of Applied Materials favorably given the company’s dominant market position and history of returning capital to shareholders.
CSX Corporation (CSX)
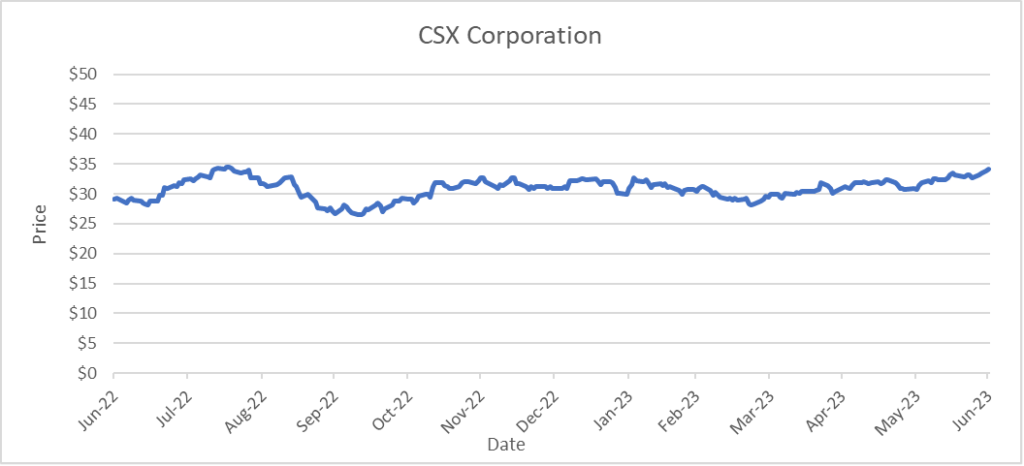
Price (June 30 ’23): $34.10 Forward P/E: 17.2
Market Cap ($B): $67.7 Price/Book: 5.5
Dividend Yield: 1.3% Price/Sales: 4.7
Return on Equity: 33.7% Debt/Equity: 1.5
Sources: Morningstar, YCharts
CSX Corporation, based in Jacksonville, Florida, operates the largest freight rail network in the eastern United States. CSX’s network spans approximately 35,000 miles across 26 states, the District of Columbia, and two Canadian provinces, securing its position as a leader in the North American transportation sector. In 2022, CSX reported revenue of approximately $15 billion from its five main lines of business: merchandise (55% of revenue), intermodal (16%), coal (16%), and trucking and other lines of business (13%).
The North American freight rail industry is characterized by high barriers to entry due to regulatory hurdles and substantial capital requirements. This dynamic has created a market structure best characterized as multiple near-duopolies, with CSX and Norfolk Southern controlling the freight rail network on the east coast. CSX’s expansive and well-connected network and its diverse revenue streams provide a durable competitive advantage. This advantage is further bolstered by the fact that rail transportation is more fuel-efficient and cost-effective compared to trucking and other forms of freight transportation, making it an attractive choice for many customers.
CSX recently reported a robust 9% year-over-year growth in quarterly sales, driven by strong demand for coal, increased auto production, and new customers. CSX’s new CEO has also made significant strides in fostering a healthier work environment, making significant inroads with employees and unions. In May, CSX was recognized for its exceptional service performance, standing out among U.S. Class 1 railroads by meeting all its one-year targets, thereby exempting it from the need to submit biweekly service progress reports to federal regulators. In contrast, competitor Norfolk Southern had two high profile train derailments during 2023.
Despite a strong start to the year, CSX anticipates challenges for the rest of 2023 due to elevated inventory levels, lower imports, and a softening truck market, combined with rising interest rates and high inflation. Although these factors will likely pressure performance over the short term, CSX’s duopoly-like pricing power and focus on operational efficiency should still position CSX for future growth.
CSX’s shares trade at a price to forward earnings ratio of 17.2 times, which is slightly below the five-year average of 18.2 times. The company has shown strong profitability, with high margins and a healthy balance sheet. We also like management’s commitment to returning capital to shareholders, as evidenced by last year’s $4.7 billion in share buybacks and increased dividend payout. We believe CSX is well-positioned in a high-barrier industry with attractive financial performance and the promise of growth, despite some short-term challenges.
Disclosures
This material represents an assessment of the market and economic environment at a specific point in time and is not intended to be a forecast of future events or a guarantee of future results. Forward-looking statements are subject to certain risks and uncertainties. Actual results, performance, or achievements may differ materially from those expressed or implied. Information is based on data gathered from what we believe are reliable sources. It is not guaranteed as to accuracy, does not purport to be complete, and is not intended to be used as a primary basis for investment decisions. It should also not be construed as advice meeting the particular investment needs of any investor. Past performance does not guarantee future results.
Indices are unmanaged, and investors cannot invest directly in an index. Unless otherwise noted, performance of indices does not account for any fees, commissions, or other expenses that would be incurred.
The S&P 500 index is an unmanaged group of securities considered to be representative of the stock market in general. It is a market value-weighted index with each stock’s weight in the index proportionate to its market value.
The Bloomberg Barclays U.S. Aggregate Bond Index is a broad-based market capitalization-weighted bond market index representing intermediate term investment grade bonds traded in the United States. Investors frequently use the index as a proxy for measuring the performance of the U.S. bond market.
Exchange Traded Funds (ETF’s) are sold by prospectus. Please consider the investment objectives, risks, charges, and expenses carefully before investing. The prospectus, which contains this and other information about the investment company, can be obtained from the Fund Company or your financial professional. Be sure to read the prospectus carefully before deciding whether to invest.
[i] The Nasdaq Composite Index is a market-capitalization weighted index of the more than 3,000 common equities listed on the Nasdaq stock exchange. The types of securities in the index include American depositary receipts, common stocks, real estate investment trusts (REITs) and tracking stocks. The index includes all Nasdaq listed stocks that are not derivatives, preferred shares, funds, exchange-traded funds (ETFs) or debentures.
[ii] Purchasing managers’ indexes (PMI) are economic indicators derived from monthly surveys of private sector companies. The three principal producers of PMIs are the Institute for Supply Management (ISM), which originated the manufacturing and non-manufacturing metrics produced for the United States, the Singapore Institute of Purchasing and Materials Management (SIPMM), which produces the Singapore PMI, and the Markit Group, which produces metrics based on ISM’s work for over 30 countries worldwide. The PMI index is based on five major indicators: new orders, inventory levels, production, supplier deliveries and the employment environment.
[iii] The Consumer Price Index (CPI) is a measure of inflation compiled by the US Bureau of Labor Studies.
[iv] Portfolio holdings are subject to change without notice. All recommendations are based upon our experience and may or may not have been profitable in the past, now or in the future.