Quarterly View: July 2022
Jul 15, 2022All About Earnings
We are now halfway through 2022, which is proving to be a challenging year in the markets. Stocks have declined sharply due to concerns about inflation and the potential for a recession, yet some measures such as unemployment, which remains near historical lows, still point to a healthy economy.
Over the next several weeks, companies will report results for the second quarter and share their outlooks for the coming quarters. Along with management’s comments, these results will provide crucial information for investors to digest as they try to predict the direction of the economy and stocks amidst central bankers’ attempts to tame high inflation around the world, signs of slowing economic growth, ongoing war in Ukraine, lockdowns in China, and other issues.
We will be monitoring these reports closely and are optimistic that stock prices already reflect most of the bad news that may be coming. We also acknowledge that stocks could fall further still before rebounding as they have after each previous downturn.
Second Quarter Review
The issues affecting markets in the second quarter were largely the same as in the first: persistently high inflation, interest rate hikes by the U.S. Federal Reserve Board and other central banks, ongoing war in Ukraine, and economic and supply chain issues related to the COVID pandemic. Stocks fell throughout the second quarter, and the S&P 500 index delivered a total return, including dividends, of -20%. Bonds also added to losses, with the Bloomberg Barclays U.S. Aggregate Bond Index declining 10% for the first half of the year.
The Fed continued its efforts to fight high inflation by raising the federal funds rate by 0.5% in May and another 0.75% in June. The second increase was the largest rate hike since 1994. The Bureau of Economic Analysis reported that U.S. gross domestic product fell in the first three months of the year, and there were other signs of slowing economic growth at home and abroad. New home construction cooled as interest rates and mortgage payments rose. Nevertheless, consumers continued to spend, particularly on services including travel and leisure, a result of the pent-up demand related to pandemic shutdowns.
So far this year, consumer discretionary, communications services, and technology stocks have led the market’s declines. Investors sold shares of consumer discretionary companies due to fears about the impact on household budgets of rising prices of gas and other goods. After many years of outperformance, shares in technology companies corrected sharply due to investor concerns about the economy and valuation in the sector. The energy sector was a lone bright spot during the first half of the year, as the price of oil surged due to supply concerns related to the Russian invasion of Ukraine and resulting sanctions. Energy shares fell toward the end of the second quarter, however, as oil prices moderated.
Outlook
This current corporate earnings season should be enlightening at a critical time for the U.S. and global economies. Despite the pullback in stocks and cautionary signs regarding economic growth, analysts’ estimates for earnings increases in the second half of 2022 remain rather high. Corporate leaders may temper expectations on their upcoming earnings calls, causing analysts to reduce forecasts. Many companies have successfully hiked prices to compensate for the increased costs of labor and other important inputs, but others may report pressure on profit margins. We expect some reduction in earnings growth forecasts but are hopeful that the outlook will be less dire than expected.
The employment situation will also remain top of mind. Businesses hired 372,000 workers in June, a strong rate in line with the monthly average of 383,000 over the prior three months despite recent indications that some large employers are beginning to slow hiring efforts. Total employment is currently down only 0.3% from its pre-pandemic level, and the unemployment rate of 3.6% is almost as low as the 3.5% rate in February 2020.
All eyes will also be on the Fed and its moves to tame inflation. Chair Powell has made it clear that the Fed will take actions against inflation even at the risk of putting the economy into recession. The Fed will probably continue to raise rates into 2023, but there are some signs that inflation may have peaked despite the high inflation recently reported for June. Easing inflation would reduce the risk of recession by removing pressure on the Fed to raise rates further.
COVID remains an issue, particularly as new variants appear to be more contagious than prior ones. The Chinese government’s aggressive efforts to contain the spread of the virus have included ongoing lockdowns that have caused further problems with global supply chains, as have the ongoing war in Ukraine and related sanctions.
Overall, we see a global economy that is struggling to maintain growth in the face of rising prices for many goods and services that threaten to curtail consumer spending. Businesses are also becoming more cautious with spending and hiring plans. However, key fundamentals such as robust employment and interest rates still near historical lows point to strength in the economy. The United States may experience a recession later this year or in 2023, but we expect any recession to be shallow and short-lived.
Following the decline in prices, the stock market is more reasonably valued now, trading at about 16 times estimated earnings for the coming twelve months as compared to 19 times at the end of the first quarter. Key to this measure is whether earnings forecasts for the coming quarters are too optimistic. Even if analysts reduce estimates over the next few weeks, we believe the market is already pricing in much of the risk of recession.
Investment Implications
We are taking advantage of the broad downturn to purchase shares of companies that we believe are high quality businesses with bright futures. We are buying shares after a decline in their prices, a drop that we think undervalues the businesses’ earnings prospects, particularly for those companies that can increase prices to maintain profit margins. In our opinion, these investments should provide attractive returns over the long term.
Some bonds are becoming more appealing now that yields have risen, but we are wary of the potential for yields to increase further, thus decreasing the value of bonds. We still generally prefer high yielding equities of companies such as pipeline operators, real estate investment trusts (REITs), utilities, and others that have the capacity to increase dividends or other payouts to shareholders.
Analysis of Selected Securities
The following is a discussion of three securities we own and have bought recently. Due to factors specific to each company, these stocks are, in our opinion, priced attractively in the markets today.
Nexstar Media Group, Inc. (NXST)

Price (6/30/2022): $162.88 Fwd P/E: 7.4
Market Cap ($B): $6.7 Price/Book: 2.3
Dividend Yield: 2.2% Price/Sales: 1.5
Return on Equity: 32.3% Debt/Equity: 2.5
Sources: Morningstar, YCharts
Nexstar Media Group is the largest television station owner and operator in the United States. The company has 199 television stations in 116 markets, including 12 of the top 20 television markets, and reaches over 65% of U.S. TV households. Of its 199 stations, 155 are affiliated with the four national broadcasters: CBS (32%), Fox (27%), NBC (22%), and ABC (19%). Nexstar also owns NewsNation, a nationwide pay-television network, and has a 31% ownership stake in the Food Network.
Although the U.S. broadcast television marketplace is dominated by the four national networks, the actual broadcast signals are transmitted by local television stations within a designated market area. While some local stations in major markets are owned and operated by the networks, most are owned by other businesses such as Nexstar. Additionally, due to Federal Communications Commission regulation, cable operators and other pay-television distributors are required to set aside a specified portion of their channels for local television stations. Furthermore, the cable operator or distributor cannot replace a local channel with a feed from a neighboring market, meaning that any pay-television distributor, traditional or streaming, must negotiate on a market-by-market basis and pay a fee to retransmit the local broadcast channels.
As a result, retransmission revenue has grown rapidly as a source of revenue for local television station owners. Over the past decade, broadcast networks and local stations have been successful in aggressively negotiating higher fees by leveraging their content and sports broadcast rights. For Nexstar, retransmission revenue has grown to represent 53% of total revenue in 2021, up from 25% of total revenue in 2014. Another importance source of revenue for Nexstar and other local television station owners is advertising. Nexstar generates a majority of its advertising revenue by selling ad time to local businesses, including auto dealerships, restaurants, and retailers. Political ad spending has also helped bolster Nexstar’s advertising revenue with ad spending usually spiking in mid-term election years and growing larger in presidential election years.
Several trends threaten the U.S. broadcast television market and traditional advertising. Advertising spending is increasingly focused on digital advertising, leaving local television stations facing stagnant to slowly declining ad revenue. In addition, the cord-cutting trend and viewer shift to on-demand subscription viewing services pressure both advertising and retransmission revenue for local station owners. Nevertheless, we believe that local television stations will remain important to advertisers looking to reach many customers at once and expect Nexstar to be a major force in the broadcast television market due to its size and geographic reach.
Trading at a current price to forward earnings ratio of 7.4x and an above average dividend yield of 2.2%, Nexstar shares offer an attractive risk-return profile. We expect the firm to continue to use the majority of its excess cash flow to increase its dividend and repay debt from previous acquisitions of local television station networks.
CVS Health Corporation (CVS)
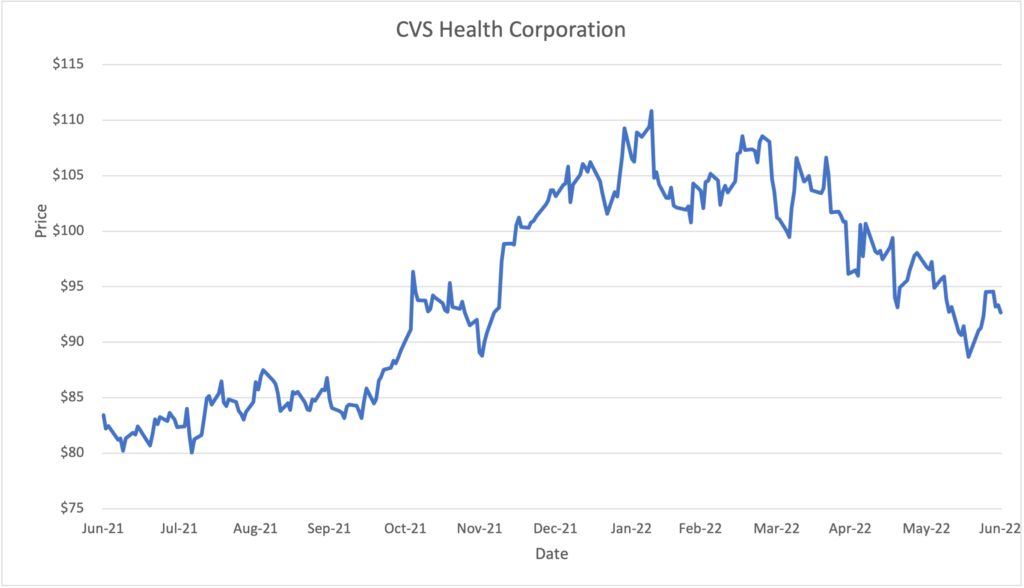
Price (6/30/2022): $92.66 Fwd P/E: 11.2
Market Cap ($B): $120.1 Price/Book: 1.7
Dividend Yield: 2.4% Price/Sales: 0.4
Return on Equity: 11.1% Debt/Equity: 1.0
Sources: Morningstar, YCharts
CVS operates one of the largest drug store chains in the United States with over 9,900 retail locations and 1,200 walk-in health care clinics across all 50 states. After the acquisitions of Caremark in 2007 and Aetna in 2018, CVS also became one of the largest pharmacy benefits managers, with more than 100 million plan members, and a health insurance provider serving an estimated 35 million people.
CVS’s operations are divided into three segments: retail (30% of 2021 revenue), pharmacy services (46%), and health care benefits (24%). The retail segment consists of the company’s traditional store offerings including prescription drugs and a wide assortment of general merchandise such as over-the-counter drugs, personal care products, and cosmetics. The pharmacy services segment provides a full range of pharmacy benefit management services, including plan design and administration. The health care benefits segment offers traditional, voluntary, and consumer-directed health insurance products and services.
The company’s three distinct segments have helped CVS become one of the largest customer-centric health companies in the United States, with the potential to improve health outcomes and even reduce healthcare costs for its clients. Particularly in the pharmacy services and healthcare benefits segments, CVS’s scale provides better negotiating leverage with drug manufacturers and health service providers, allowing CVS to offer lower costs and more benefits to members compared to peers. Consequently, CVS is able to attract both new clients and health providers, further strengthening its insurance network. More recently, the COVID-19 pandemic has helped drive increased foot traffic at CVS stores as people lined up to get COVID tests and vaccines. CVS continues to dive further into healthcare services through its plans to offer more primary care services as it shifts to addressing holistic health.
We agree with CVS’s recent focus on using cash flows to repay its debt from the 2018 Aetna acquisition and are encouraged that the board of directors authorized a 10% dividend increase and new $10B share repurchase program to resume during 2022, now that CVS’s debt is at a more reasonable level. We also continue to view CVS shares, trading at 11.2x forward earnings, as attractively valued relative to their long-term growth prospects.
Visa Inc. (V)
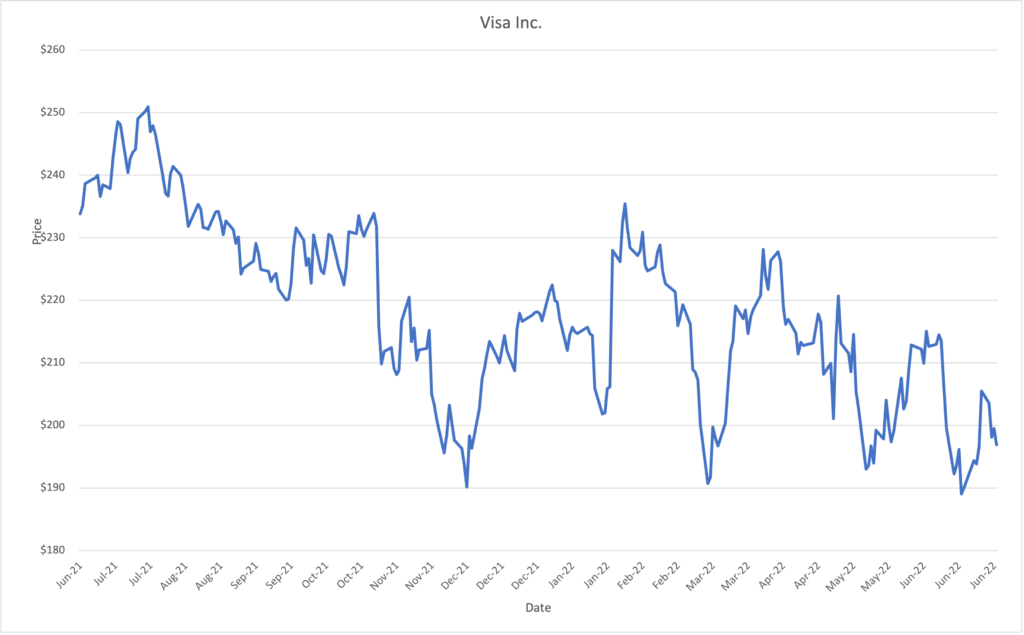
Price (6/30/2022): $196.89 Fwd P/E: 24.3
Market Cap ($B): $427.7 Price/Book: 13.1
Dividend Yield: 0.7% Price/Sales: 16.4
Return on Equity: 40.9% Debt/Equity: 0.5
Sources: Morningstar, YCharts
Visa operates the world’s largest retail electronic payments network, processing transactions in over 160 currencies across more than 200 countries. Visa’s core products include its transaction processing infrastructure along with credit, debt, and prepaid cards that connect consumers, businesses, banks, and governments and enable them to make digital payments. Visa’s customers include over 15,000 financial institutions that issue Visa-branded products and nearly 80 million merchant locations.
Visa derives the majority of its revenue from fees charged on the payment of goods and services using Visa-branded cards. The company’s revenues can be divided into three primary segments: service fees (35% of 2021 gross revenue), which are mainly assessed as a percentage of payments volume for usage of Visa’s payment services; data processing fees (39% of revenue), which are dependent on the number of transactions processed; and international transaction fees (20% of revenue), which are charged on transactions for which the card issuer and merchant are located in different countries.
Visa is not a financial institution and does not issue cards or extend credit. The company instead derives its economic moat, or protection from competition, from the global electronic payment and processing infrastructure that it created. With over 3.3 billion Visa cards currently in circulation, the scale and complexity of Visa’s network would be difficult for new entrants to replicate. The more consumers that use Visa’s payment network, the more attractive that payment network becomes for merchants, further reinforcing Visa’s network effect and adding to its economic moat.
We believe that Visa still has favorable long-term growth prospects. The major trend driving Visa’s growth is the shift toward digital payments and decline in cash and check transactions. On a global basis, digital payments surpassed cash payments just a few years ago, with further opportunities to grow in emerging markets. Furthermore, the increasing usage of mobile payments and e-wallets does not hurt Visa’s growth, since most payments are still linked back to a Visa-branded card. Over the shorter-term, we also like that Visa is partially insulated from supply chain issues and inflationary pressures, as volume-based service fees are expected to increase with higher prices for goods and services. Additionally, international transaction fees, which are more lucrative for Visa, are expected to rebound over the coming years as global travel recovers following the COVID-19 pandemic.
After pulling back over the past year, Visa shares currently trade at a price to forward earnings ratio of 24.3x, below their historical five-year average ratio of 30.3x. We believe this reduced valuation presents a good opportunity to own shares of a company with a wide economic moat and strong balance sheet, while compensating for the risks of decelerating global economic growth and possibility of weaker consumer spending over the near term. Although the current dividend yield of 0.7% is lower than that of the broader market, we appreciate that Visa pays a stable dividend and expect it to continue growing steadily over the coming years given Visa’s balanced exposure to consumer spending and the growth in digital payments.
Disclosures
This material represents an assessment of the market and economic environment at a specific point in time and is not intended to be a forecast of future events or a guarantee of future results. Forward-looking statements are subject to certain risks and uncertainties. Actual results, performance, or achievements may differ materially from those expressed or implied. Information is based on data gathered from what we believe are reliable sources. It is not guaranteed as to accuracy, does not purport to be complete, and is not intended to be used as a primary basis for investment decisions. It should also not be construed as advice meeting the particular investment needs of any investor. Past performance does not guarantee future results.
Indices are unmanaged, and investors cannot invest directly in an index. Unless otherwise noted, performance of indices does not account for any fees, commissions, or other expenses that would be incurred.
The S&P 500 index is an unmanaged group of securities considered to be representative of the stock market in general. It is a market value-weighted index with each stock’s weight in the index proportionate to its market value.
The Bloomberg Barclays U.S. Aggregate Bond Index is a broad-based market capitalization-weighted bond market index representing intermediate term investment grade bonds traded in the United States. Investors frequently use the index as a proxy for measuring the performance of the U.S. bond market.
Exchange-traded funds (ETFs) are sold by prospectus. Please consider the investment objectives, risks, charges, and expenses carefully before investing. The prospectus, which contains this and other information about the investment company, can be obtained from the fund company or your financial professional. Be sure to read the prospectus carefully before deciding whether to invest.
The S&P SmallCap 600 Index is an index of small-capitalization stocks managed by Standard and Poor’s. It tracks a broad range of small-sized companies that meet specific liquidity and stability requirements, determined by specific metrics such as public float, market capitalization, and financial viability, among a few other factors.
The Russell 2000 Index is an unmanaged index that measures the performance of the small-capitalization segment of the U.S. equity universe.
A REIT is a security that sells like a stock on the major exchanges and invests in real estate directly, either through properties or mortgages. REITs receive special tax considerations and typically offer investors high yields, as well as a highly liquid method of investing in real estate. There are risks associated with these types of investments and include but are not limited to the following: potential difficulty discerning between routine interest payments and principal repayment; redemption price of a REIT may be worth more or less than the original price paid; value of the shares in the trust will fluctuate with the portfolio of underlying real estate; and involves risks such as refinancing in the real estate industry, interest rates, availability of mortgage funds, operating expenses, cost of insurance, lease terminations, potential economic and regulatory changes. This is neither an offer to sell nor a solicitation or an offer to buy the securities described herein. The offering is made only by the prospectus.