Quarterly View: January 2023
Jan 11, 2023Welcome, 2023!
We are glad to ring in 2023, leave 2022 behind, and move into what will hopefully be a better year in the markets. The U.S. Federal Reserve’s actions to slow the economy and tame inflation appear to be working, but the economy is still relatively strong by some measures, particularly employment. While the United States may experience a recession later this year or in 2024, we believe any recession is likely to be brief and mild.
The truth is that nobody knows exactly what 2023 will bring in economic news and the markets. While we can make predictions for what may happen in the short term, we make investments in expectation of good results over the long term, even with rough stretches in the market along the way. We are optimistic that the U.S. and foreign economies will expand over time and markets will provide attractive returns for patient and disciplined investors with sound strategies, even as the stock market likely remains volatile this year.
Review of Fourth Quarter and 2022
Stocks in the S&P 500 index rebounded in the fourth quarter of 2022, returning 7.6% with dividends included but still leaving the index down 18.1% for the year, its worst performance since 2008. The NASDAQ index plummeted nearly 33% as investors soured on technology stocks, which had led gains for several years.
Bonds had their worst year since records began. The Bloomberg Barclays U.S. Aggregate Bond Index dropped 13% for the year even after gaining 1.9% in the fourth quarter. The yield on the 10-Year Treasury remained steady during the quarter at about 3.9%, up sharply from 1.5% at the beginning of the year.
Inflation has been the main focus for investors, who watched closely as prices rose during the year at the fastest pace in 40 years. Extraordinary events – including supply chain issues related to the COVID-19 pandemic, increasing rents due to pandemic-related migration, and Russia’s invasion of Ukraine – were among the primary causes of inflation. While these and other issues constrained supply, consumer demand remained strong partly because of low unemployment and increasing wages. The annual core inflation rate peaked at 6.6% in September before declining in November to 6%, still high by historical standards.
In response to rising inflation, the Fed hiked its federal funds rate seven times over the course of the year for a total increase of 4.25%, the largest since 1980. The most recent rate hike of 0.5% in December was less than the 0.75% rise in each of the previous four Fed actions, a more moderate move reflecting data showing that inflation had started to wane. Some analysts had hoped that easing inflation might lead to rate cuts by the Fed in 2023, but Fed officials emphasized their determination to raise rates further, if necessary, and not make cuts until inflation is clearly under control.
Employment data remains strong but is showing some signs of easing as employers see the possibility of an economic slowdown. After averaging 562,000 new jobs each month in 2021, employers added an average of 375,000 per month in 2022 and 223,000 in December.
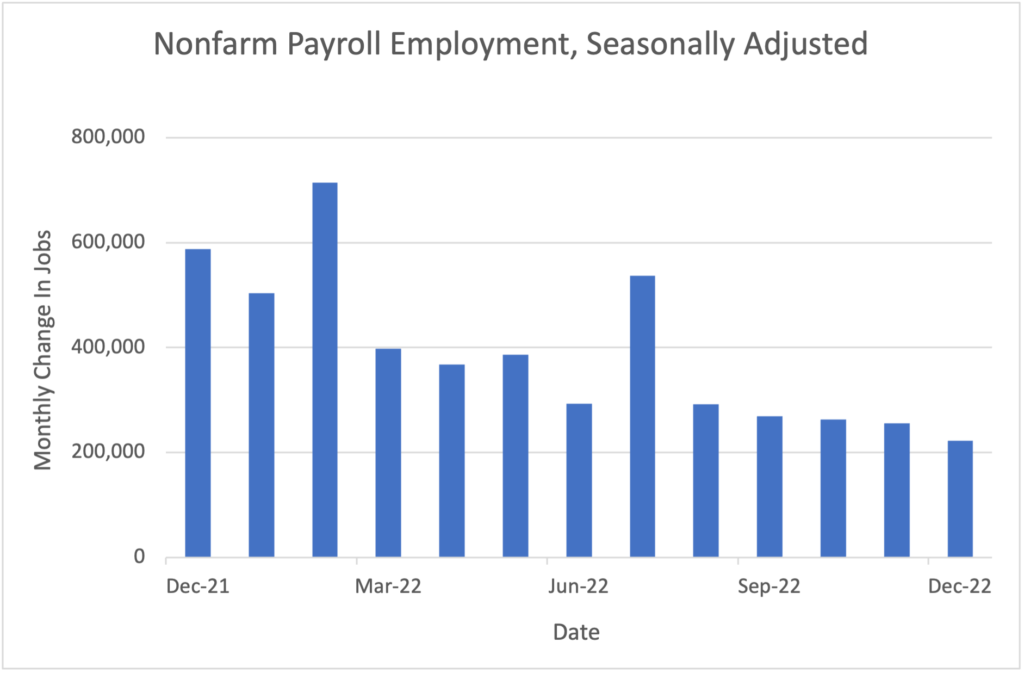
Source: Bureau of Labor Statistics
The unemployment rate dropped to 3.5% in December and has been in a narrow range of 3.5% to 3.7% since March. Job openings remained steady at just over 10 million, and wages rose 4.6% over the twelve months through December, a healthy increase but a slight decline from November and lower than inflation over that period. This employment data is evidence of a jobs market that is cooling slightly but is still strong and a threat to the Fed’s efforts to reduce inflation by slowing the economy.
Analysts lowered corporate earnings forecasts throughout the quarter and currently expect a roughly 4% decline in profits for the fourth quarter compared to a year earlier, which would mark the first drop since the third quarter of 2020. Consumer spending growth has moderated due to concerns about a potential recession in 2023, though savings that remain above historical levels should provide some cushion.
Outlook for 2023: The Fed’s Conundrum
As we enter the new year, we anticipate more market volatility due to uncertainty about inflation, the Fed’s moves to tame it, and the potential for a recession. We do not expect another downturn like we saw in 2022, but stock returns may be modest until the economic picture becomes clearer.
The Fed is likely to raise rates further, though probably at a slower pace than in 2022. Chair Powell and his colleagues will continue to wrestle with balancing actions to slow economic growth and reduce inflation with their desire to avoid sending the economy into recession. However, the Fed has clearly stated that its top priority is to bring inflation to a level closer to its long-term target of 2% annually, even if doing so leads to recession. The Fed wants to avoid raising rates too slowly or too modestly, which could boost consumer and business confidence and cause inflation to stay high.
In a good sign for the Fed and its efforts, inflation expectations have dropped recently. Rents also appear to be falling, though the impact will not affect inflation numbers until more existing leases renew over the next year.

We continue to monitor foreign matters, including the war in Ukraine and rising COVID-19 cases in China, that are hindering the global economy. The Ukraine war does not have a clear outcome, but mild winter weather so far has reduced natural gas prices, mitigating the potential negative economic and humanitarian impact of Russia’s curtailment of gas shipments to Europe. COVID-19 outbreaks in China after an easing of lockdown restrictions threaten to constrain the economy there and impact supply chains and demand for imported goods from other countries dependent on Chinese consumption. Global supply chains have improved significantly in recent months, but there is still limited availability of some materials and goods.
As earnings forecasts have declined and the S&P 500 index has risen over the past several months, the forward price/earnings ratio on the index has increased to 16.5x, up from 15.3x at the end of the third quarter. The price/earnings ratio is now below the average for the past 5 and 10 years.
As always, we are monitoring our investments closely and are looking for opportunities to invest in securities that are now attractively priced and offer the potential for robust long-term returns. The rise in interest rates has increased the appeal of bonds, particularly higher-quality government and corporate bonds, which are an important component of our income allocations.
Good riddance to 2022, welcome 2023, and here’s to better times ahead. We are optimistic that those better times are coming this year, and we are also ready to seize opportunities to make good long-term investments as we wait for the market to improve.
Analysis of Selected Securities
The following is a discussion of several securities we own and have bought recently. Due to factors specific to each company, these securities are, in our opinion, priced attractively in the markets today.
Alphabet Inc. (GOOG)
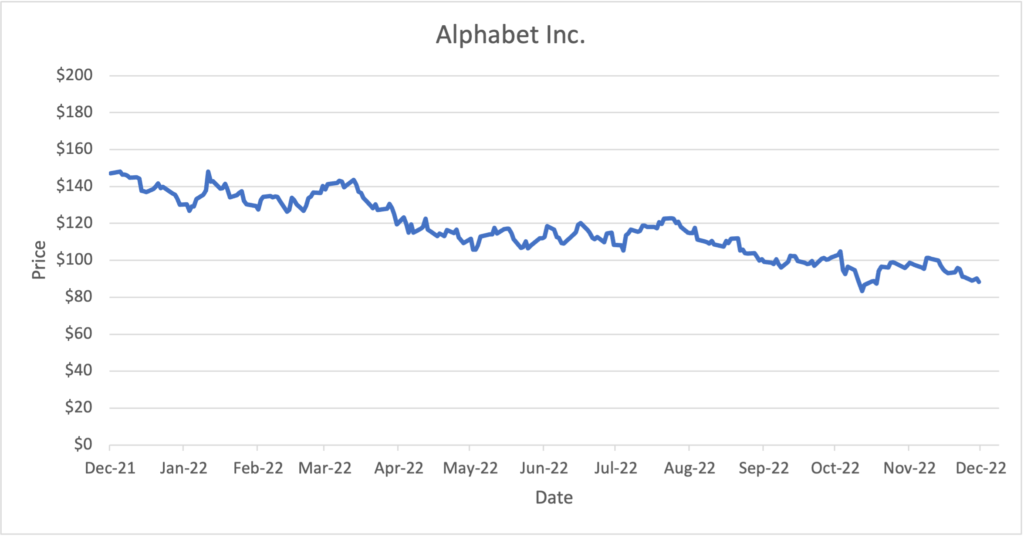
Price (12/30/2022): $88.73
Forward P/E: 16.8
Market Cap ($T): $1.1
Price/Book: 4.5
Dividend Yield: 0.0%
Price/Sales: 4.2
Return on Equity: 26.9%
Debt/Equity: 0.1
Sources: Morningstar, YCharts
Alphabet Inc. is a multinational conglomerate headquartered in Mountain View, California. Created in 2015 as a restructuring of Google, Alphabet’s subsidiaries include Google’s search business, YouTube, Google Cloud Platform, Waymo, and Google Play Store. 80% of Alphabet’s $280 billion in annual revenue comes from advertisements related to search and YouTube.
With market share of about 90% in many countries, Google is the dominant company in the search industry. Google’s search engine is widely regarded as the most accurate and comprehensive, attracting more search volume, further improving search results, and helping the company maintain its dominant position. In a classic example of the network effect, Google becomes more valuable and useful the more people use it, ongoing improvement that attracts even more users. Google has leveraged its superiority in search to create an advertising platform, Google Ads, that allows businesses to place ads on Google’s search results and other websites, reaching a wide audience of potential customers.
In the cloud computing industry, Google is a relatively newer entrant but has made significant inroads in recent years. Google Cloud Platform is projected to generate $25 billion in revenue this year, making it the third largest public cloud provider behind Amazon Web Services and Microsoft’s Azure. In the latest quarter, revenue grew 38% compared to the same quarter last year, outperforming Amazon and Microsoft, and losses declined.
As Google’s search business matures, we see Google Cloud Platform and YouTube as excellent and complementary opportunities for future growth. YouTube has risen to become the second most visited site worldwide (behind Google.com), resulting in over 500 hours of video uploaded every minute and providing Google Cloud Platform with demand.
Alphabet is facing increased scrutiny from governments and regulatory bodies worldwide related to charges of anticompetitive behavior and the company’s practices regarding data privacy and security. We believe these are serious risks and are monitoring them closely. Ultimately, we are optimistic about Alphabet’s prospects in court and believe cash flows will remain strong even after changes to business practices and payment of any fines or penalties.
Like other tech companies, Alphabet’s stock price is down significantly this year, but we believe investors are currently undervaluing the company’s long-term prospects. Trading at just 16.8x forward earnings, Alphabet is valued below the S&P 500, Nasdaq-100, and the shares’ five-year average of 25.7x. Alphabet doesn’t pay a dividend but is buying back stock at an annual rate of almost $60 billion and still has $120 billion in cash. We see the recent focus on costs and slowdown in hiring as positive developments, and we believe the current share price offers an excellent opportunity to own a dominant, growing, and highly profitable business at an attractive valuation.
Lowe’s Companies, Inc. (LOW)
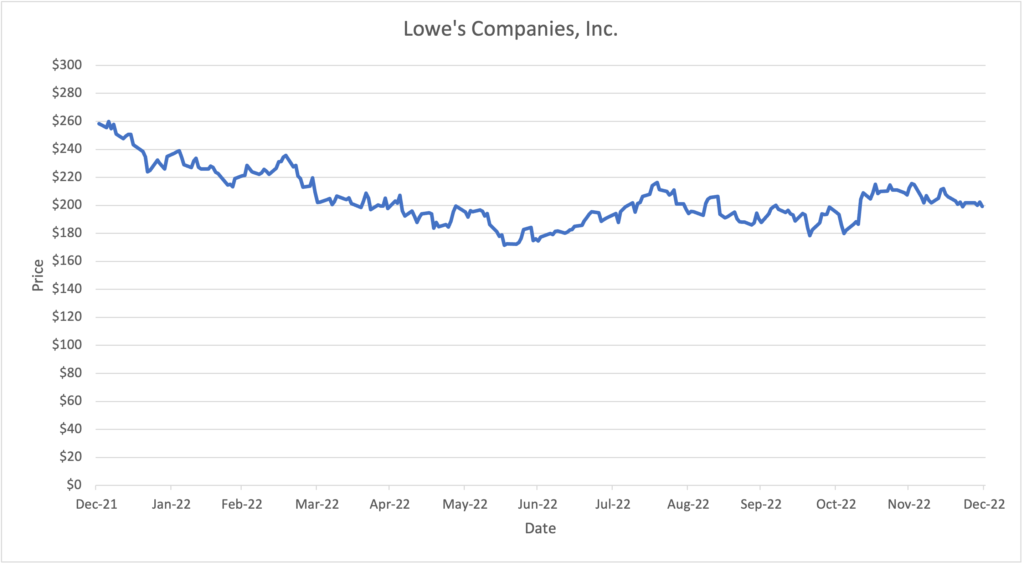
Price (12/30/2022): $199.24
Forward P/E: 14.1
Market Cap ($B): $120.6
Price/Book: NM
Dividend Yield: 2.1%
Price/Sales: 1.4
Return on Equity: NM
Debt/Equity: NM
Sources: Morningstar, YCharts, Argus
The world’s second largest home improvement retailer, Lowe’s operates more than 2,200 home improvement and hardware stores in the United States and Canada. The company’s primary merchandise divisions are home décor (35% of 2022 sales); building products (34%); and tools, lawn & garden, and seasonal products (29%). Lowe’s has historically made a larger percentage of sales to individual consumers compared to its larger competitor, Home Depot, which has had a more even split of sales to both individuals and maintenance, repair, and construction professionals.
Lowe’s has accumulated a strong market share of the home improvement retail segment given its extensive store and distribution network as well as strong brand awareness. Furthermore, the diversity of products offered in addition to the robust knowledge of store associates regarding home improvement projects has helped Lowe’s build loyal customer relationships. In general, home improvement stores have been more resilient to competition from online retailers, such as Amazon, since both individual and professional customers prefer to shop or pickup items in stores.
Lowe’s faces a cyclical retail environment in which sales are driven largely by homeowners’ spending. Lower income growth and concerns about borrowing due to higher interest rates have the potential to constrain spending on building and remodeling projects, many of which are discretionary. More than half of purchases made at Lowe’s stores are related to less cyclical upkeep and maintenance, but the current interest rate tightening cycle by the Fed and fears of another recession are likely to weigh negatively on the company’s performance in the near term.
Nevertheless, we remain optimistic regarding the business’s longer-term prospects. According to Argus, about 70% of U.S. homes are more than 25 years old and likely in need of upgrades and repairs. Additionally, home improvement spending has been more resilient compared to other segments of the retail sector since home equity can often represent a large portion of an individual’s net worth. Lowe’s has been refining its strategy since bringing on a new management team in 2018, with a sharper focus on its core business and improving efficiency. Specifically, Lowe’s has been improving its store layouts, expanding its buy online/pick up in store functionality, and developing better membership service and loyalty programs to attract more professional customers.
In our view, Lowe’s has a sound balance sheet with manageable debt levels. Cash flows from operations has been consistently positive for more than 10 years, with Lowe’s choosing to return excess cash to shareholders through both dividends and share buybacks. We continue to view Lowe’s shares favorably at their current price to forward earnings multiple of 14.1x, which is below the stock’s five-year average multiple of 17.7x and Home Depot’s current multiple of 18.9x.
Bonds
The outlook for bonds is now more attractive relative to the past decade given the rise in interest rates, which caused bond prices to drop over the past year. In particular, we favor higher-quality government and corporate bonds in our income allocations. U.S. Treasurys, which are considered by most investors to be risk-free given the low likelihood of the United States ever defaulting, are yielding between 4.4% and 4.8% for shorter dated notes maturing between 3 months and 2 years. Longer dated Treasurys are yielding less, with the 5-year Treasury yielding 4.0% and the 10-year Treasury yielding 3.9%, due to expectations for a possible recession and future interest rate cuts by the Federal Reserve.
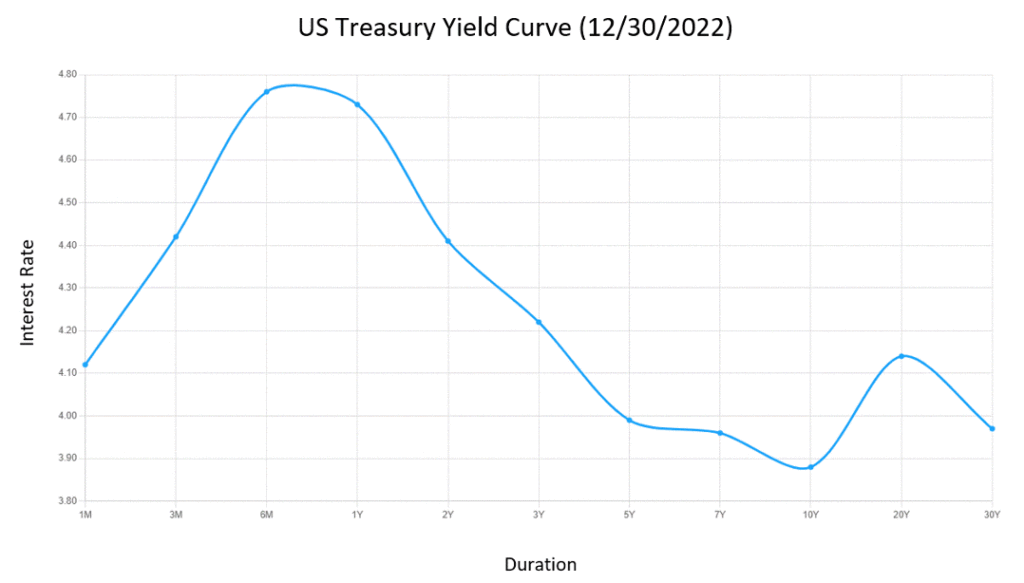
Sources: U.S. Department of Treasury, https://www.ustreasuryyieldcurve.com
To gain exposure to attractive short-term yields in our clients’ income portfolios, we favor the iShares Ultra Short-Term Bond ETF (ICSH). The fund invests in short-term U.S. dollar denominated investment grade debt securities and money market instruments with maturities of usually less than one year. The fund’s 30-day SEC yield, which is based on estimated net income over the next 12 months, is 4.2%. We also have exposure to U.S. Treasurys through the iShares Core U.S. Aggregate Bond ETF (AGG), which invests approximately 40% of the fund’s assets in U.S. Treasurys and has a 30-day SEC yield of 3.9%.
iShares Core US Aggregate Bond ETF (AGG)
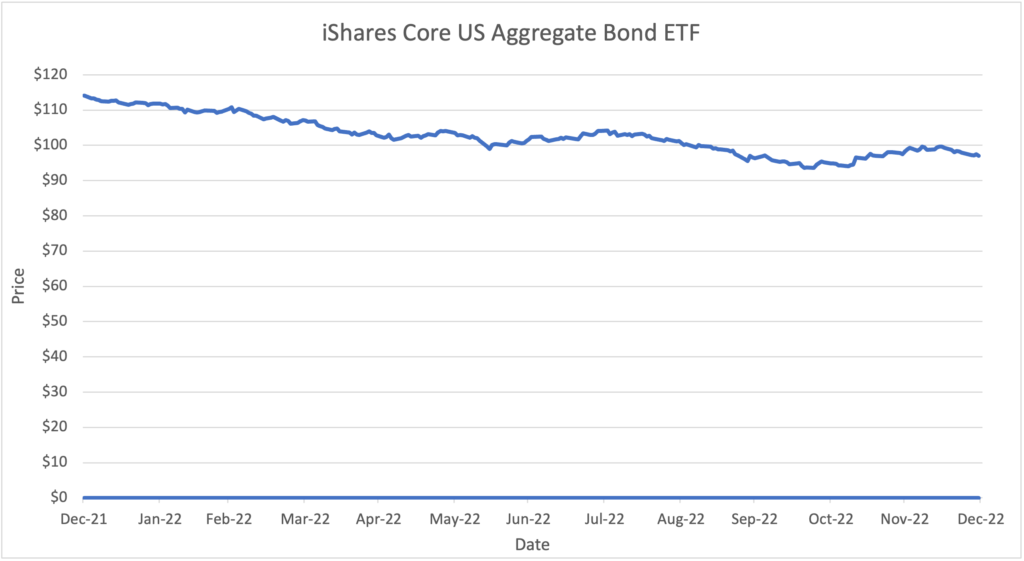
Price (12/30/2022): $96.99
Assets Under Management ($B): $85.4
Annual Expense Ratio: 0.03%
Trailing Distribution Yield: 2.3%
30-Day SEC Yield: 3.9%
Sources: Morningstar, YCharts, FRED Economic Data
Although corporate bonds carry more default risk, they compensate investors with a higher yield relative to Treasury securities. Investment grade corporate bonds are considered to be higher quality and carry lower default risk, historically paying a spread of 1.0% to 2.0% above U.S. Treasurys. We favor the iShares Broad USD Investment Grade Corporate Bond ETF (USIG), which provides exposure to a wide set of U.S. investment grade corporate bonds and has a 30-day SEC yield of 5.4%.
High yield bonds are issued by companies that are considered to be at greater risk of not being able to repay their debt and tend to also have higher debt ratios. To gain exposure to high yield bonds, we prefer the iShares Fallen Angels USD Bond ETF (FALN). The fund targets a portion of the high yield universe which has historically exhibited higher credit quality than the broader high yield bond market by investing in a subset of high yield bonds that were previously rated investment grade. The fund has a 30-day SEC yield of 7.7%.
Similar to the high yield market, leveraged loans are issued by companies that tend to be rated below investment grade. Since these loans have floating rates that increase if benchmark rates rise, they have less interest rate risk compared to regular bonds. The Nuveen Floating Rate Income Fund (NFRIX) provides exposure to floating rate loans and focuses on larger, more liquid (easily traded) loans from the leveraged loan universe. The fund has a 30-day SEC yield of 7.4%. Given the more illiquid nature of leveraged loans, with loan trades often taking up to a week or more to settle, we decided to swap previous holdings of closed-end funds with this mutual fund.
We believe these funds are an integral part of a balanced income portfolio. With higher yields available in the market today, these bond funds have become more attractive, and we expect healthy returns from them over the coming years.
Disclosures
This material represents an assessment of the market and economic environment at a specific point in time and is not intended to be a forecast of future events or a guarantee of future results. Forward-looking statements are subject to certain risks and uncertainties. Actual results, performance, or achievements may differ materially from those expressed or implied. Information is based on data gathered from what we believe are reliable sources. It is not guaranteed as to accuracy, does not purport to be complete, and is not intended to be used as a primary basis for investment decisions. It should also not be construed as advice meeting the particular investment needs of any investor. Past performance does not guarantee future results.
Indices are unmanaged, and investors cannot invest directly in an index. Unless otherwise noted, performance of indices does not account for any fees, commissions, or other expenses that would be incurred.
The S&P 500 index is an unmanaged group of securities considered to be representative of the stock market in general. It is a market value-weighted index with each stock’s weight in the index proportionate to its market value.
The Bloomberg Barclays U.S. Aggregate Bond Index is a broad-based market capitalization-weighted bond market index representing intermediate term investment grade bonds traded in the United States. Investors frequently use the index as a proxy for measuring the performance of the U.S. bond market.
The S&P SmallCap 600 Index is an index of small-capitalization stocks managed by Standard and Poor’s. It tracks a broad range of small-sized companies that meet specific liquidity and stability requirements, determined by specific metrics such as public float, market capitalization, and financial viability, among a few other factors.
The Russell 2000 Index is an unmanaged index that measures the performance of the small-capitalization segment of the U.S. equity universe.