Quarterly View: January 2022
Jan 13, 2022Broken Records
Ever since the pandemic-induced downturn in early 2020, the market has maintained its mostly steady rise and quickly recovered from the few pullbacks along the way. This pattern repeated in the fourth quarter of 2021. After falling in September, the U.S. stock market resumed its upward march in October and continued to hit new highs through the end of the year.
We begin 2022 with the Omicron variant of COVID-19 running rampant yet proving so far to cause less severe illness than the Delta variant. Stocks have declined to begin the year as investors eye persistently high inflation, reduction of stimulus from the Federal Reserve, lack of progress on spending bills in Congress, and uncertainty regarding COVID-19’s impact on the coming quarters. Good economic reports and expectations of strong corporate earnings for the fourth quarter and 2022 counter these concerns. We remain optimistic that stocks should continue their run, and we are also prepared for the likelihood that there will be some setbacks along the way.
Fourth Quarter and 2021 Review
Following a drop in September over concerns about the Delta variant’s impact on the economy, stocks recovered sharply through mid-November. By December, the Omicron variant had begun to spread, and stocks declined briefly before rising again to hit new record highs. The S&P 500 index returned 11.7% for the fourth quarter and 28.7% for the full year, including dividends.
Major themes during the quarter were mostly the same as in previous quarters, with a few twists. First and foremost, COVID-19 persisted as the most important factor impacting the global economy and, therefore, the markets. The Delta variant was waning as the fourth quarter began, and the quarter ended with cases from the Omicron variant surging well beyond previous case numbers. Fortunately, serious illnesses from Omicron have been lower than for previous variants, but the outbreak has still caused disruption, including travel cancelations, delayed school returns, and curtailment of other activity due to workers’ illness and concerns regarding the safety of returning to work.
Uncertainty regarding the strength of the economy was a second theme during the quarter. On the one hand, consumer spending was robust, unemployment dropped significantly as the labor market strengthened, and corporate earnings reports for the third quarter beat high expectations. On the other hand, economists lowered forecasts for fourth quarter economic growth due to the uncertainty regarding Omicron’s impact, as worker shortages and supply chain issues combined with signs that people were starting to curb some activities, such as dining out and traveling.
A third theme continuing in the quarter was the potential for changes in government support for the economy. The Fed began tapering its bond purchases to clear the way for interest rate increases, which are likely to begin in March 2022. Meanwhile, political disfunction continued. Congress was unable to pass the proposed major spending bill, forcing Democrats to start considering changes that would boost its prospects of passing.
Finally, conditions abroad remained uncertain and mixed. The recovery in Europe continued, but Omicron-related shutdowns interrupted the momentum. The Chinese government took restrictive actions against technology and internet companies and implemented fiscal regulations to reduce borrowing, particularly in the property sector, and economic growth in China slowed to about 5% annually.
Outlook for the New Year
As we enter the new year, investors are assessing these same factors and their effect on investment prospects for the coming quarters. Despite falling in the first days of trading in the new year, stocks are still hovering near all-time highs. We believe returns will moderate in 2022 after averaging over 25% for the past three years. Nevertheless, we are optimistic that stocks can deliver attractive performance in 2022 and beyond.
We expect COVID-19 to stay atop the list of concerns, given its ability to create uncertainty and hinder economic growth. Medical experts anticipate that new cases from the Omicron variant will decline beginning in January, but new variants are likely to follow. Fortunately, widespread vaccination in the United States has muted the impact of Omicron, and ongoing efforts to increase vaccinations and encourage booster shots should help further diminish its consequences.
As the world increasingly adapts to life with COVID-19, we expect resolution of most of the supply chain issues that have hurt the economy. Specifically, progress toward elimination of shipping constraints and shortages of microchips and other key materials will likely help get goods moving more normally again. The ripple effect of these improvements throughout the economy should result in strong GDP growth in 2022. However, results will be more muted than they were last year when the economy rebounded from the sharp drop in 2020.
The Fed will continue to wrestle with its approach to monetary policy, trying to balance its sometimes-conflicting goals of keeping inflation controlled and achieving full employment. Recently released minutes from the December Fed meeting indicated the Fed’s willingness to reduce the assets on its balance sheet, another method of decreasing monetary stimulus. Unemployment dropped to 3.9% in December, which is below the Fed’s 4% definition of full employment and gives the Fed a reason to tighten policy. The Fed will likely increase rates several times this year, but interest rates should still stay near historical lows. Real (inflation-adjusted) interest rates will probably remain negative for a while. We do believe inflation will fall from its current high levels as supply constraints ease and people return to work, and we are optimistic that the Fed will not need to hike rates so quickly as to choke the economy.
Analysts are forecasting corporate earnings growth of about 22% when S&P 500 index companies soon report results for the last quarter of 2021. Such a result would mark the fourth straight quarter of at least 20% earnings growth, reflecting the strong recovery from 2020’s downturn. The earnings outlook for 2022 is positive. Analysts are calling for earnings to increase about 9% for the full year, which would be a strong showing even if lower than last year’s increases from 2020’s depressed levels. We will be watching results, looking particularly for signs that the companies we own have been able to maintain profit margins by passing along price increases to customers or reducing costs.
Global economies will likely continue their recovery from pandemic shutdowns.
Vaccination efforts and central bank policy in Europe, Asia, and elsewhere will remain important factors affecting the rebound. Risks to ongoing recovery include potential political conflict, such as Russia’s massing of troops around Ukraine and feuding between the United States and China. Also, the economic slowdown in China threatens to hinder the growth of other economies that depend on the Chinese markets for sales of raw materials and goods.
We believe economic prospects are positive overall, and robust corporate earnings, strong consumer spending, and low interest rates should create a favorable environment for stocks in 2022. Even with the price/earnings ratio for the S&P 500 index at about 21 times, higher than its long-term average, we believe stocks can continue their run. However, we also expect the market to pull back periodically and would not be surprised to see a more significant downturn after a long period of mostly upward moves. Growth stocks, including those in the technology sector, could be particularly affected by higher interest rates, which reduce the value of companies’ future earnings.
As mentioned in our previous outlook, we are limiting our bond exposure in the income portion of portfolios. We continue to prefer the higher yields of dividend equities such as utilities, pipeline companies, real estate investment trusts, business development companies, and preferred stocks.
Analysis of Selected Securities
The following is a discussion of three securities we own and have bought recently. Due to factors specific to each company, these stocks are, in our opinion, priced attractively in the markets today.
Broadcom Inc. (AVGO)
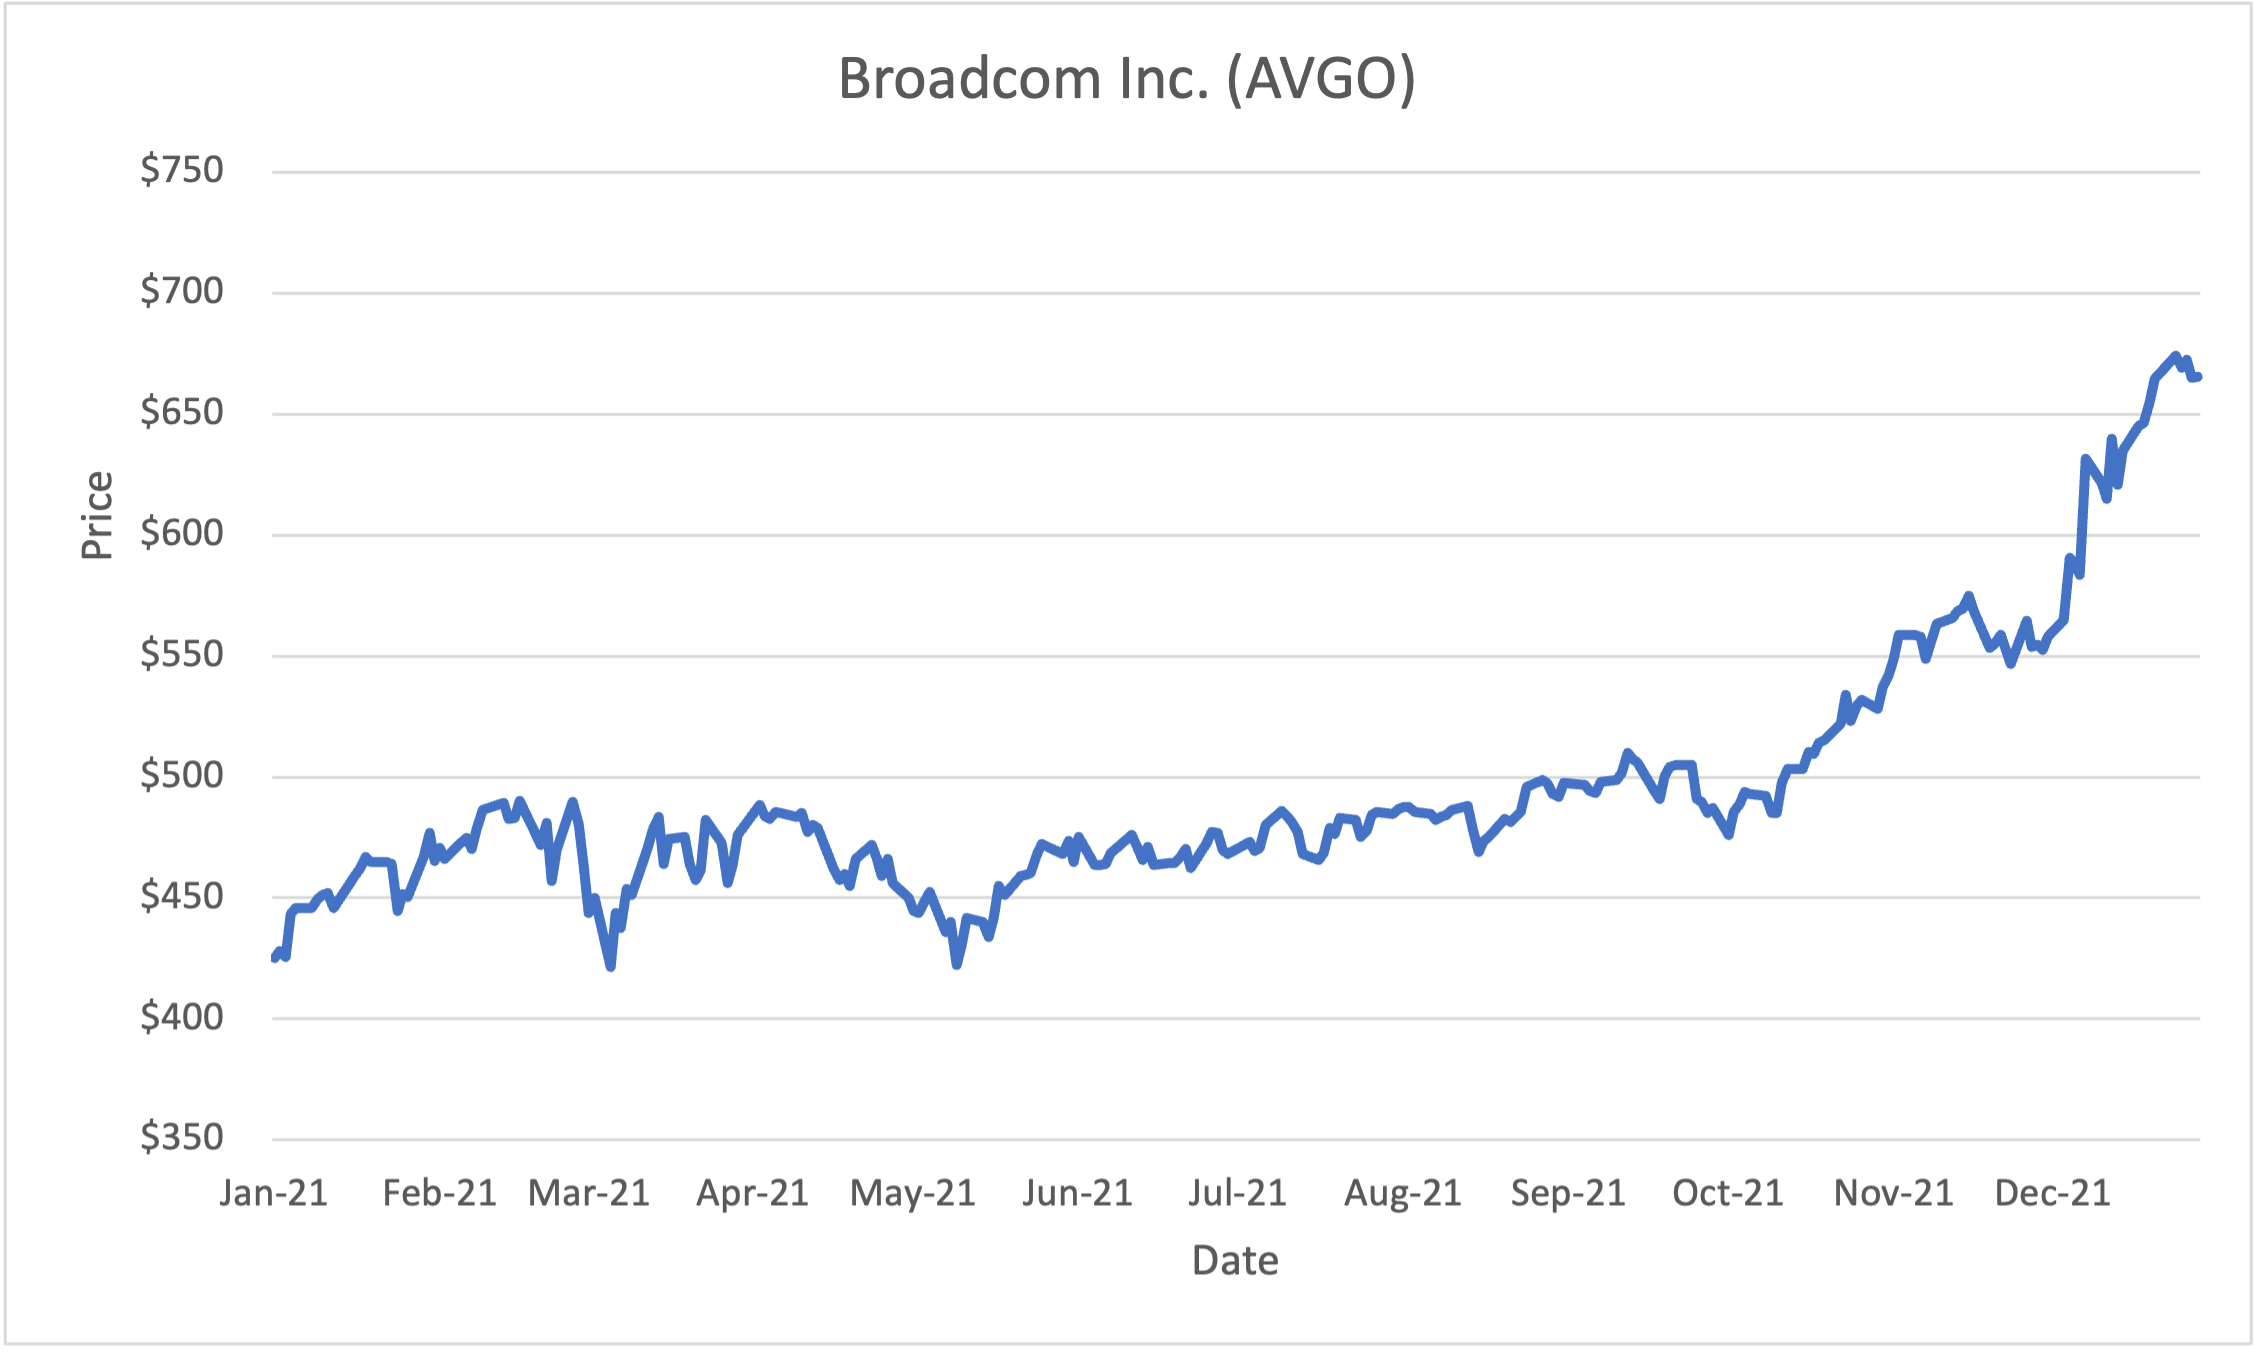
- Price (12/31/21): $665.41
- Market Cap ($B): $265.5
- Dividend Yield: 2.6%
- Return on Equity: 26.4%
- Forward P/E: 19.5
- Price/Book: 10.6
- Price/Sales: 10.1
- Debt/Equity: 1.6
Sources: Morningstar, YCharts
Broadcom Inc. is one of the world’s largest semiconductor manufacturers. The company designs, develops, and supplies a broad range of semiconductors (74% of 2021 sales) and infrastructure software products (26% of 2021 sales) and was formed by the merger of Avago Technologies and Broadcom in 2016. The combination of Avago’s expertise in radio frequency filters for smartphones and legacy Broadcom’s dominance in networking, broadband, and wireless connectivity created a diversified semiconductor company that serves the wired and wireless communications, enterprise data center, and industrial end markets. Broadcom subsequently ventured into the infrastructure software industry by acquiring CA Technologies in 2018 and Symantec’s enterprise security business in 2019.
Broadcom’s diversity across markets has helped to increase its revenue and overall success. Approximately 20% of Broadcom’s sales come from the high-end smartphone market, and the company also has market leadership positions in areas such as Wi-Fi chips, set-top box chips, enterprise storage chips, and networking switches. These segments generate solid cash flows that the company can reinvest to remain competitive in its core markets.
Broadcom’s infrastructure and security software products segment adds to its competitive advantages. About 80% of Broadcom software customers are licensed to five or more offerings for an average term of three years. These software products have helped Broadcom increase its proportion of recurring revenue and contributed to overall margin expansion due to software’s higher profitability relative to semiconductors.
Broadcom posted double-digit revenue growth in 2021, driven by a rebound in demand for semiconductors due to ongoing cloud data center spending and a recovery in enterprise technology spending as offices reopened and businesses resumed equipment upgrades. Additionally, the global launch of next- generation smartphones helped strengthen demand for Broadcom’s products in the wireless communications end market. We believe Broadcom will likely continue to benefit from higher spending from cloud customers and telecom providers seeking to upgrade their infrastructure and networks, especially amid the ongoing 5G rollout. We also believe that the continued use of smartphones and expanding market for Wi-Fi-enabled devices will drive demand for Broadcom’s switches and connectivity chips. Although manufacturing lead times remain extended due to disruptions from the pandemic, Broadcom’s supply chain remains stable, and order backlog continues to grow.
We consider Broadcom to be fairly valued at 19.5 times projected earnings, below the market average price to forward earnings ratio. The company has a long history of returning value to its shareholders via dividends and share buybacks, as well. Broadcom recently announced a new $10 billion share repurchase program and increased its quarterly dividend by 14%, resulting in a current dividend yield of 2.6%, which is higher than the yield of the broader market.
iShares Core S&P Small-Cap ETF (IJR)
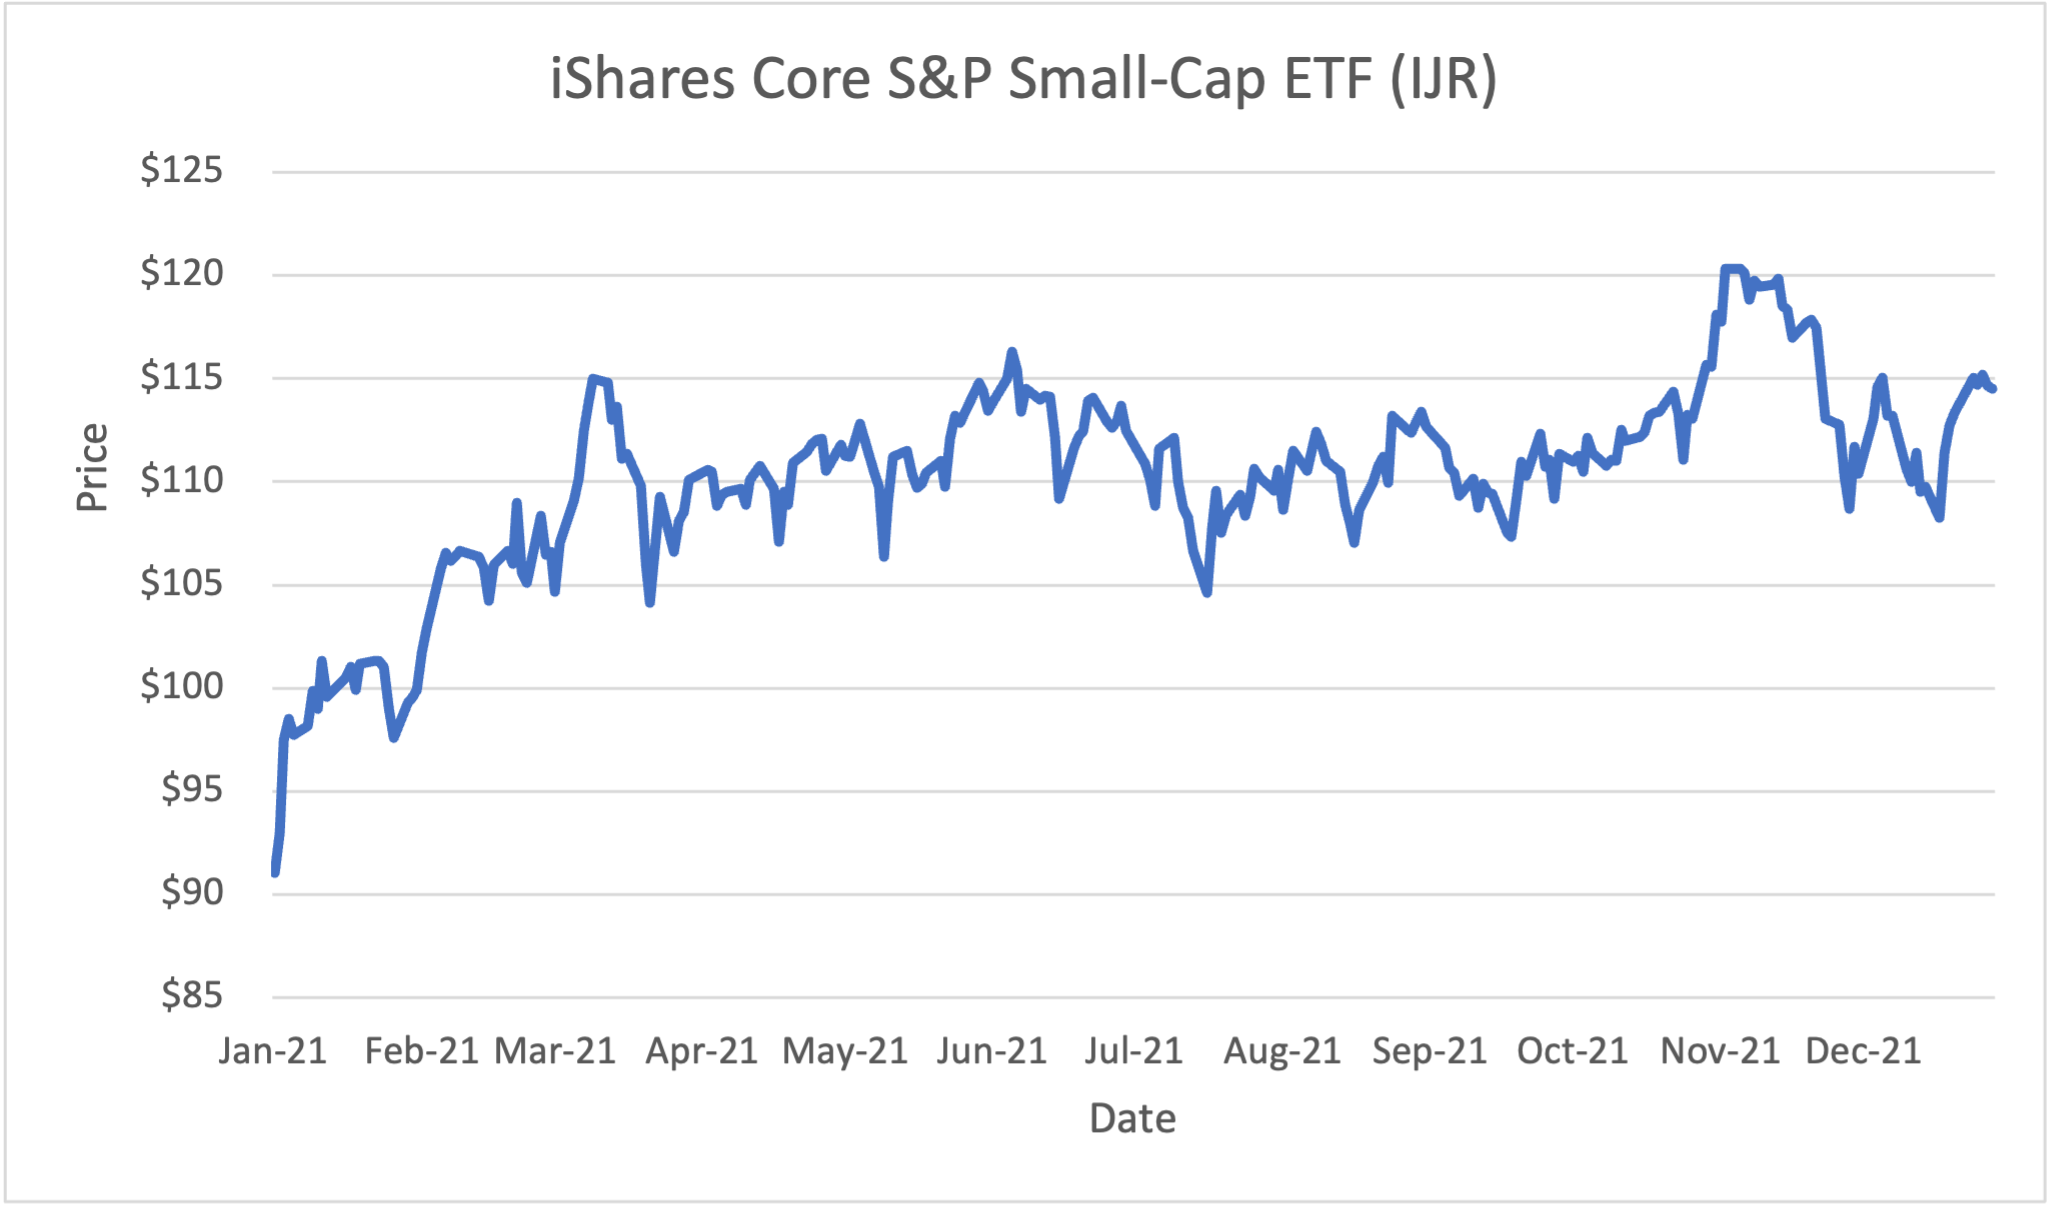
- Price (12/31/2021): $114.51
- Assets Under Management ($B): 75.0
- Annual Expense Ratio: 0.06%
- Forward P/E: 14.0
- Dividend Yield: 1.2%
Sources: Morningstar, YCharts
The iShares Core S&P Small-Cap ETF (IJR) is an exchange-traded fund that provides diversified exposure to small-capitalization U.S. equities. The fund tracks the S&P SmallCap 600 Index, which seeks to capture the bottom 2.5% of the total investible U.S. equity market based on market capitalization.
What sets the S&P SmallCap 600 Index apart from other small-capitalization indexes, such as the broader Russell 2000 Index, is that the index’s 600 constituents are selected based on meeting criteria for market capitalization (between $700 million and $3.2 billion), profitability, and liquidity. Most importantly, the S&P committee requires that the companies have positive earnings for the most recent quarter as well as over the past four quarters. We find this focus on higher-quality companies advantageous when investing in small- capitalization stocks. The index’s criteria help to ensure that the selected companies are less vulnerable to higher interest rates and will have less volatile returns during market downturns. Accordingly, IJR outperformed other small- capitalization index peers during the coronavirus shock from February to March 2020, when the companies in the fund were able to weather the market downturn better than peers.
Small-capitalization stocks tend to be less frequently traded and less widely followed by analysts. Consequently, small-capitalization stocks often trade at discounted valuations compared to large-capitalization stocks. Over the past year, the discount between small- capitalization stocks and large-capitalization stocks has widened, resulting in what we believe is an attractive outlook for small-capitalization stocks. IJR trades at a current price to forward earnings ratio of 14 times, which is below the price to forward earnings ratio of 21 times for the S&P 500 index.
Furthermore, small-capitalization stocks are forecasted to have a five-year earnings growth rate of 16% compared to a five-year earnings growth rate of 14% for the S&P 500 index. IJR is also more concentrated in the financial, industrial, materials, and energy sectors, which results in a value stock emphasis that we expect to be favorable for IJR as more cyclical industries do well in an inflationary and higher- rate environment.
We have continued to add small-capitalization exposure to client portfolios to take advantage of the attractive valuation of small-capitalization stocks relative to their large-capitalization peers, and we believe that IJR provides better-quality holdings within the small-capitalization universe. We also like that IJR has one of the lowest expense ratios for index-tracking peers, with a charge of only 0.06% annually.
Simon Property Group, Inc. (SPG)
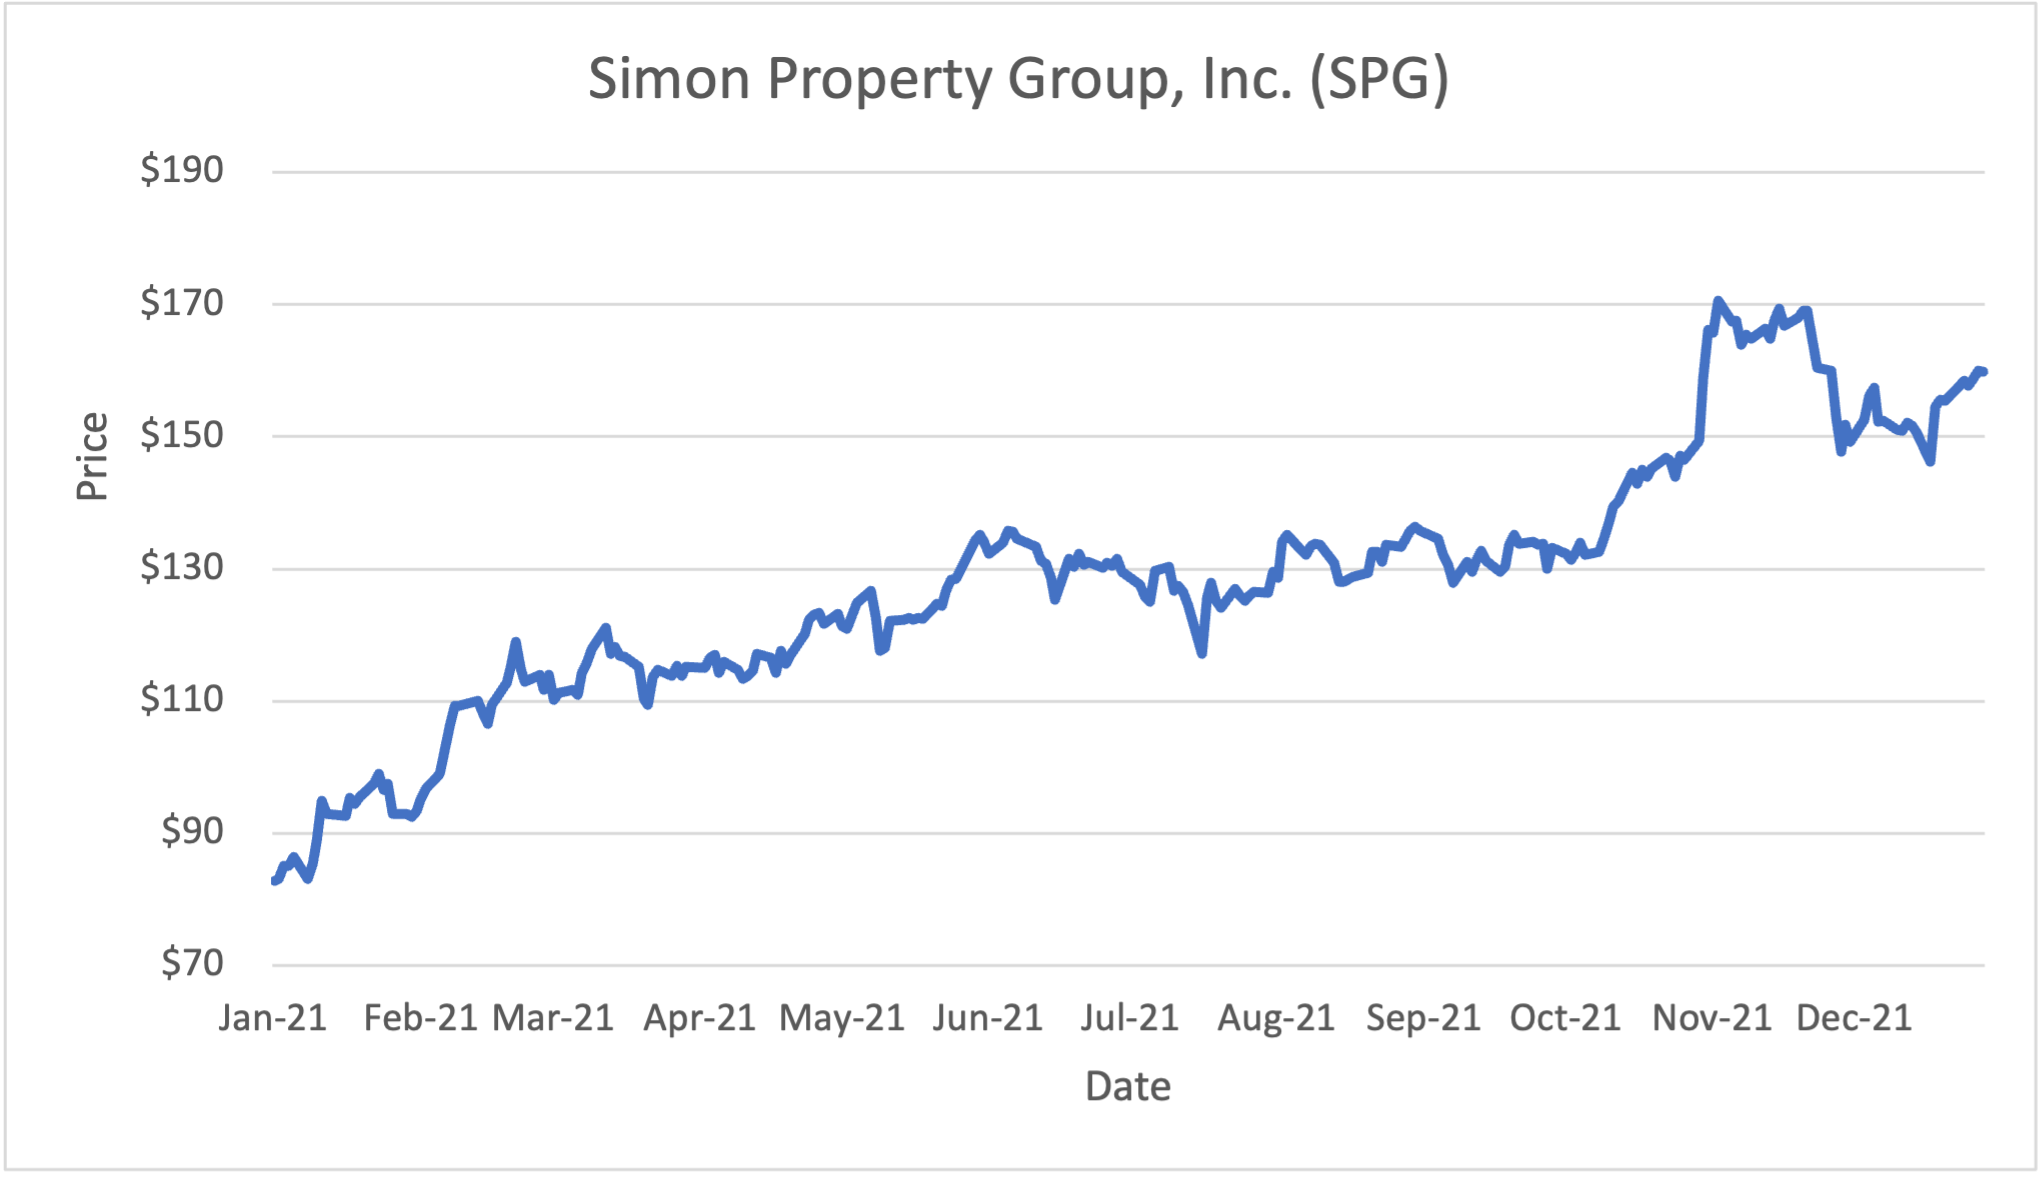
- Price (12/31/2021): $159.77
- Market Cap ($B): $53.6
- Dividend Yield: 4.1%
- Return on Equity: 79.8%
- P/FFO*: 14.1
- Price/Book: 16.1
- Price/Sales: 10.8
- Debt/Equity: 7.8
*Price to Funds from Operations
Sources: Morningstar, CFRA, YCharts
Simon Property Group, Inc. is one of the largest real estate investment trusts (REITs) in the United States that owns and leases malls and outlet centers. The company’s portfolio consists primarily of traditional malls, premium outlets, and Mills centers (a combination of a traditional mall, outlet center, and big-box retailers). Simon owns or has interest in 233 properties with 191 million square feet of leasable space across North America, Europe, and Asia. Simon also owns an 80% noncontrolling interest in the Taubman Group, a REIT that mainly operates high-end malls, and a 22% equity stake in Klepierre, a Paris-based real estate company with investments in shopping centers across Europe.
Simon manages one of the best retail portfolios in the United States, operating high-quality properties strategically located in attractive markets with high foot traffic and high incomes. These favorable dynamics tend to also attract premium tenants, creating a unique shopping experience that is hard to replicate at scale.
Although Simon is not immune to the continued shift to online shopping, the reduction in retail space will likely occur predominantly at the lower end of the quality spectrum with malls that are struggling to retain tenants due to high vacancies and locations in less desirable markets. Additionally, most retailers have realized they need to pursue an omnichannel strategy, including both an online presence and physical storefronts at select locations, to remain competitive.
After weakening during the pandemic, the retail sector has started to bounce back as retailers reopen stores and consumers resume in-person shopping. During 2021, Simon’s revenue rebounded 9% relative to 2020, driven by sharply higher foot traffic at its malls and diminishing rent abatement for tenants. In addition to a fixed base rent, substantially all of Simon’s retail tenants are also required to pay variable rent based on sales over a stated base amount, which benefits Simon when in-store sales at its malls increase.
Management has pursued strategies to grow the business outside of traditional retailing, including adding more experiential tenants, such as restaurants, theaters, entertainment, and health and fitness centers, as well as exploring mixed use such as hotels. Simon has also acquired ownership stakes in troubled or bankrupt retailers that rent space at its malls, preserving well-known retail names and preventing empty storefronts at the company’s malls.
We believe that in-person shopping will remain important to consumers, and Simon’s portfolio of high-quality real estate assets and diversification across retail types and geographies should provide the company more stability in cash flows and allow it to weather the challenging retail dynamics. Simon has one of the healthiest balance sheets compared to its peers and pays a sustainable dividend relative to its operating cash flow. The shares offer a dividend yield of 4.1%, which is above its peer group average. We believe Simon Property Group is attractively priced and have continued to buy shares in income-oriented portfolios, where we still favor high yielding securities that are able to increase their dividends and partially hedge against inflation.
Disclosures
This material represents an assessment of the market and economic environment at a specific point in time and is not intended to be a forecast of future events or a guarantee of future results. Forward-looking statements are subject to certain risks and uncertainties. Actual results, performance, or achievements may differ materially from those expressed or implied. Information is based on data gathered from what we believe are reliable sources. It is not guaranteed as to accuracy, does not purport to be complete, and is not intended to be used as a primary basis for investment decisions. It should also not be construed as advice meeting the particular investment needs of any investor. Past performance does not guarantee future results.
Indices are unmanaged, and investors cannot invest directly in an index. Unless otherwise noted, performance of indices does not account for any fees, commissions, or other expenses that would be incurred.
The S&P 500 index is an unmanaged group of securities considered to be representative of the stock market in general. It is a market value-weighted index with each stock’s weight in the index proportionate to its market value.
The Bloomberg Barclays U.S. Aggregate Bond Index is a broad-based market capitalization-weighted bond market index representing intermediate term investment grade bonds traded in the United States. Investors frequently use the index as a proxy for measuring the performance of the U.S. bond market.
Exchange-traded funds (ETFs) are sold by prospectus. Please consider the investment objectives, risks, charges, and expenses carefully before investing. The prospectus, which contains this and other information about the investment company, can be obtained from the fund company or your financial professional. Be sure to read the prospectus carefully before deciding whether to invest.
The S&P SmallCap 600 Index is an index of small-capitalization stocks managed by Standard and Poor’s. It tracks a broad range of small-sized companies that meet specific liquidity and stability requirements, determined by specific metrics such as public float, market capitalization, and financial viability, among a few other factors.
The Russell 2000 Index is an unmanaged index that measures the performance of the small-capitalization segment of the U.S. equity universe.
A REIT is a security that sells like a stock on the major exchanges and invests in real estate directly, either through properties or mortgages. REITs receive special tax considerations and typically offer investors high yields, as well as a highly liquid method of investing in real estate. There are risks associated with these types of investments and include but are not limited to the following: potential difficulty discerning between routine interest payments and principal repayment; redemption price of a REIT may be worth more or less than the original price paid; value of the shares in the trust will fluctuate with the portfolio of underlying real estate; and involves risks such as refinancing in the real estate industry, interest rates, availability of mortgage funds, operating expenses, cost of insurance, lease terminations, potential economic and regulatory changes. This is neither an offer to sell nor a solicitation or an offer to buy the securities described herein. The offering is made only by the prospectus.