Quarterly View: July 2024
Jul 15, 2024- Stocks rose further in the second quarter, with the S&P 500 climbing 4.3%, including dividends, and closing the first half of 2024 with a 15.3% gain.
- Investor enthusiasm around artificial intelligence remained strong and boosted performance for the largest technology stocks, but returns languished for other shares.
- The U.S. economy continued to expand, though some economic indicators showed signs of weakness potentially emerging.
- Inflation eased after a surprise spike in March, and investors now project 1-2 Federal Reserve rate cuts by year end.
- We expect more gains for stocks in the second half of the year, despite noisy headlines related to the upcoming U.S. presidential election.
More Record Highs for Stocks
Stocks extended their current rally through the second quarter, with the S&P 500 and the Nasdaq Composite Index setting more all-time highs along the way. Equity investors continued to show enthusiasm for the promise of artificial intelligence (AI), driving demand for shares of big tech firms and the largest growth-oriented stocks. While these companies commanded the market’s attention and contributed the lion’s share to quarterly performance, strong earnings reports from the first quarter and signs of resilience in the latest economic data also set a positive tone for the equity market.
We expect positive returns for stocks to continue through year end, despite investor angst around November’s U.S. presidential election. We believe steady economic growth will continue, boosted by interest rate cuts from the Fed, and corporate earnings will remain strong, providing support for higher stock prices.
Second Quarter Review
The S&P 500 gained 4.3% in the second quarter, building on the strong performance in the first quarter to post a 15.3% total return for the first half of 2024. Most of the gains for the second quarter came from stocks in the technology sector, and even among tech stocks performance was dominated by the largest firms. For example, chipmaker NVIDIA climbed more than 36% during the quarter and is up nearly 150% for the year to date, as investors kept buying the company’s shares despite their lofty valuation.
Beyond the fervor for all things AI, continued strength in corporate earnings also helped to power the stock market higher in the second quarter. First-quarter earnings growth (reported during the second quarter) was positive in eight of the 11 S&P 500 sectors, with overall growth reported at 6.0%, the fastest pace of year-over-year growth since the first quarter of 2022. 78% of S&P 500 companies beat analysts’ earnings expectations, in line with the historical average, with the biggest surprises coming from firms in the communications and consumer discretionary sectors.
The strong financial performance from American firms has come in a generally favorable climate for the U.S. economy, though there were some signs of softening. Gross domestic product figures for the first quarter showed a slower pace of growth from the previous two quarters but remained positive, reflecting continued expansion for the U.S. economy.
Much of this growth was dependent on consumer spending, which typically represents around two-thirds of total U.S. economic activity. Retail sales have continued to increase in recent months but at a slower pace, a possible sign that consumers are tiring after months of rising prices. However, the resilient labor market supports ongoing spending, with the economy adding new jobs at a healthy pace of over 200,000 per month in both May and June. Due to the entry of more people into the workforce, the unemployment rate has ticked above 4% for the first time in over two years.
The case for optimism about the U.S. economy stems from the improving inflation picture and the likelihood for Federal Reserve rate cuts in the second half of the year. After a surprise 3.5% spike in inflation for March, investors scrapped their expectations for up to six Fed rate cuts in 2024. Subsequent inflation reports showed a slightly slower pace of price increases, down to 3.0% year-over-year for June. The Fed held firm on interest rates during the quarter and reaffirmed its commitment to reducing inflation to its 2.0% target, but the drop in inflation helped solidify the market’s revised projections for one or two rate cuts to come later this year.

Source: U.S. Bureau of Labor Statistics
Outlook
Looking ahead to the second half of the year, our outlook remains favorable for continued positive stock returns. While a market downturn is always possible, we don’t see any specific reason in the current environment for stocks to retreat sharply. Barring any external shocks, the Fed could reduce rates by a quarter-point in September, which should help ease some pressure on consumers, provide a much-needed lift to the housing market, and boost economic activity at a critical early point in the recovery cycle.
Our positive take on the economy may seem at odds with the negative view among the general public, as often reported in the mainstream and financial media. We acknowledge many individuals and households are under significant financial stress right now, and this stress impacts the financial decisions they make both in the near and long term. However, there is a notable disconnect between how many people are feeling in the current economic climate and what the more positive official numbers say.
The S&P 500 currently trades at 21 times projected earnings, higher than its historical average, but the outlook for economic growth and improved corporate earnings should offer support for higher equity prices. Analysts currently forecast an increase of nearly 9% for S&P 500 earnings in the second quarter (to be reported early in this quarter) and 11% for all of 2024. If the calendar-year estimate is accurate, it will be the strongest year for earnings growth since the pandemic-recovery year of 2021.
We are watching for signs of weakness in consumer spending, which could place pressure on company margins and earnings and hit economic growth. For example, many retailers are reporting shifts in consumer preferences as shoppers trade down from brand-name goods to cheaper alternatives. Also worrisome is the rise in credit card delinquencies, especially among lower-wage earners. Falling revenues would likely squeeze margins and earnings growth, which presents a risk to the current stock market rally.
We are also mindful of concerns around the potential impact of the upcoming presidential election on financial markets. However, in reality the markets are non-partisan; historically, there hasn’t been much variation in stock market returns when different political parties control the White House or Congress.

Data excludes 2001 to 2002 due to Senator Jeffords changing parties in 2001. Calendar year performance from 1933 through 2022. Source: Strategas Research Partners, as of November 5, 2023 and Fidelity Brokerage Services LLC
As investors, we should brace ourselves for the onslaught of news coming in the next few months, while maintaining focus on our long-term investment goals. Stay tuned to the forces that have the greatest impact on the outcome of your portfolio and financial plan — economic growth, corporate fundamentals, and how Federal Reserve decisions affect the economy and financial markets.
Further Analysis of Stock and Bond Markets
Investor excitement over artificial intelligence and a fondness for higher-growth tech stocks continued to drive the major stock market indexes higher during the quarter. Not surprisingly, the best performing sectors in the S&P 500 for the year so far were information technology and communication services, whose companies are at the forefront of developing and implementing artificial intelligence in their products and services.
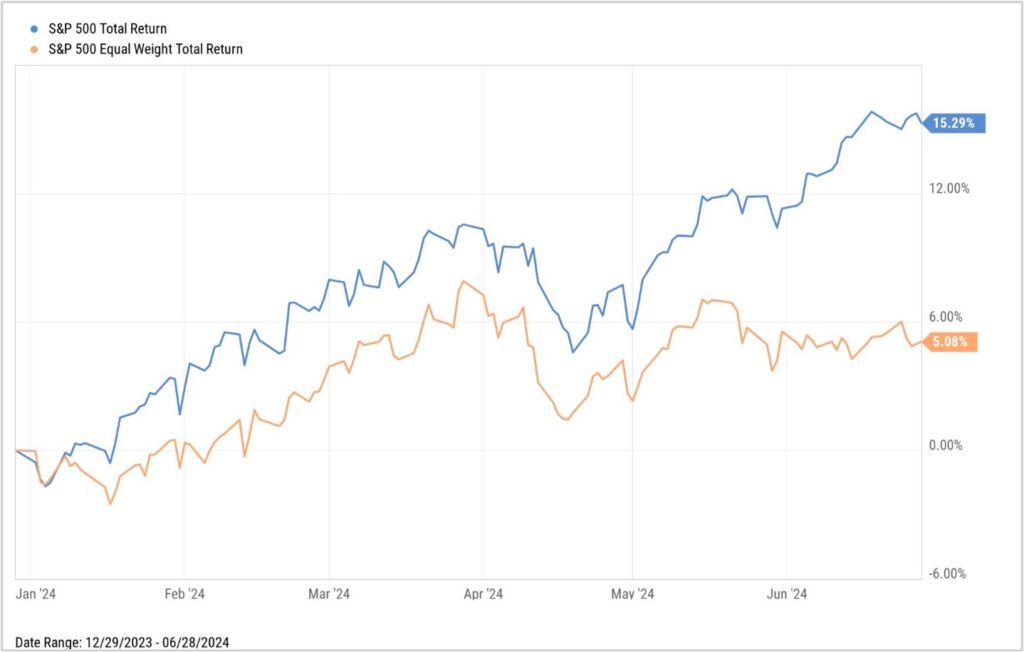
The strong performance of stocks in these sectors has prompted some fears of rising market concentration, with the three largest companies—Microsoft, Apple, and NVIDIA—together accounting for roughly 20% of the market capitalization of the S&P 500. This concentration is apparent in the stark difference in year-to-date performance between the S&P 500 and its equal-weight counterpart (which has returned 5.1%, including dividends.) As the name implies, the equal-weight S&P 500 measures all 500 stocks in the index equally and offers a clearer view of how many stocks are participating in the market’s returns. In contrast, the more commonly cited S&P 500 is weighted by market capitalization; consequently, the performance of larger stocks has more influence on the index’s overall return.

Source: YCharts
Although most sectors in the S&P 500 have notched gains during 2024, it has been hard to match the outperformance of the stocks in the tech and communication sectors, which now have a much larger influence on the broader market’s performance. The two worst-performing sectors in the S&P 500 during the year were real estate and basic materials. Concerns over rising defaults in the commercial market continue to impact the real estate sector, while falling commodity prices pressure firms in the basic materials sector.
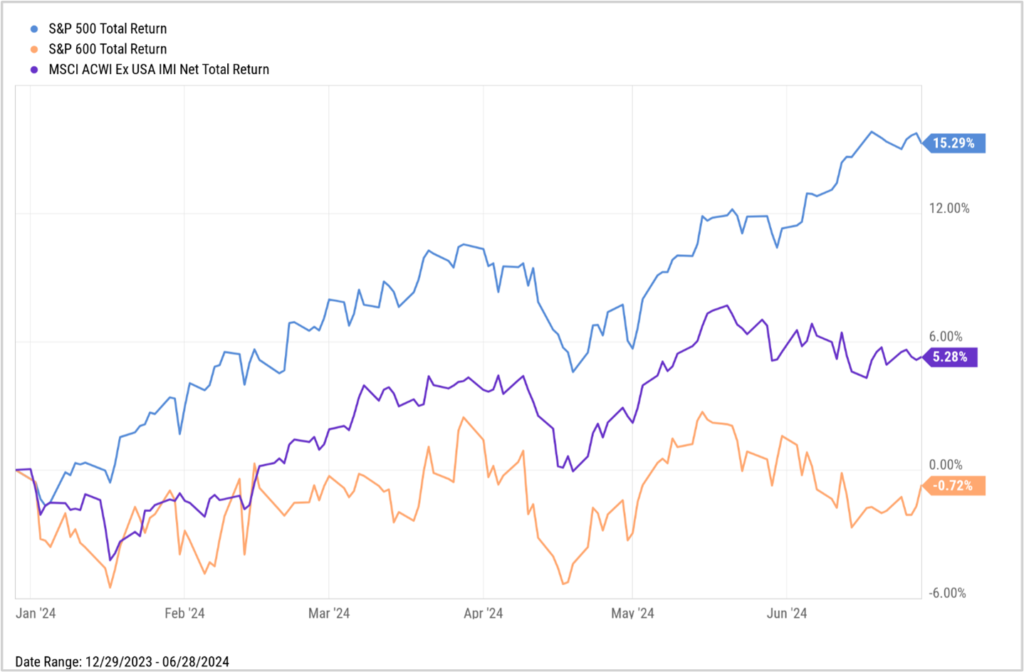
Small-capitalization stocks also continued to struggle despite the strong U.S. economy. The S&P SmallCap 600 index returned -0.7%, including dividends, for the year to date, underperforming its large-capitalization counterpart by a wide margin. Small-cap companies have borne the brunt of the Fed’s policy of higher interest rates, because these firms tend to have lower cash reserves and carry more debt on their balance sheets than their larger peers.
International stocks, as measured by the MSCI All Country World Index (ACWI) ex-USA, lagged the S&P 500 for the year to date as well. Overseas stock markets in aggregate, which comprise roughly 35% of the global stock market’s total value, have less exposure to the technology sector and more exposure to the industrial and financial sectors compared to the U.S. stock market.

Source: YCharts
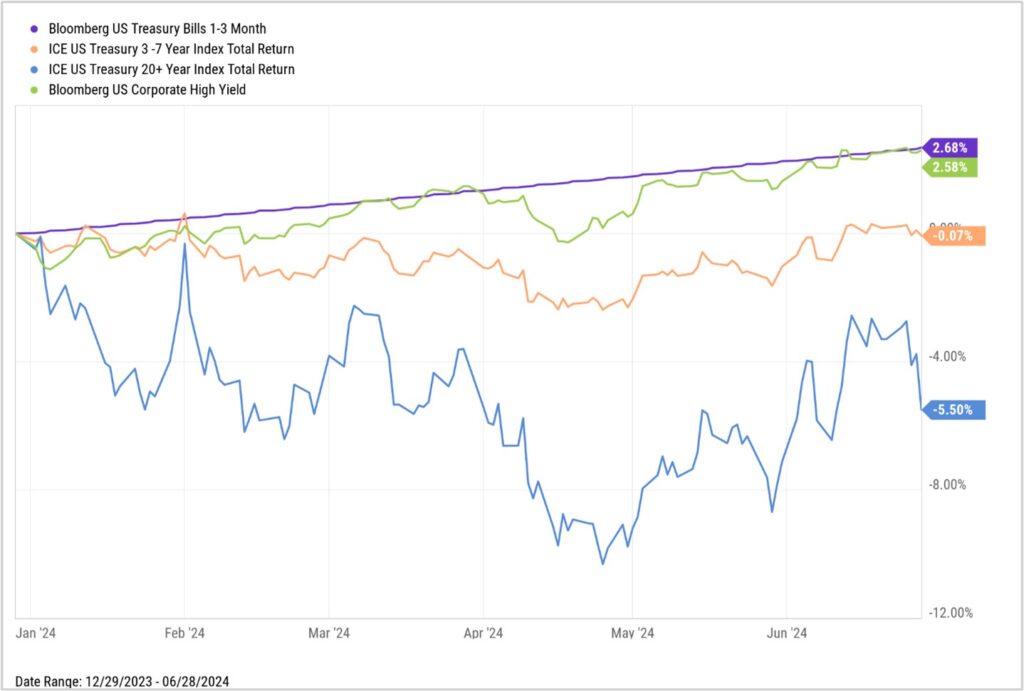
The Fed has reiterated its position that it will wait patiently before beginning to cut interest rates, despite better readings on inflation over the past few months. Markets are now pricing in a high probability of a first rate cut in September and around 50% probability of another cut by the end of 2024. The uncertainty over the timing and extent of rate cuts by the Fed has kept bond returns muted for the year to date. Similar to the trend seen during the first quarter, shorter-term bonds have continued to outperform longer-term bonds, and riskier, higher yielding corporate bonds have continued to outperform U.S. Treasurys.

Source: YCharts
Disclosures
This material represents an assessment of the market and economic environment at a specific point in time and is not intended to be a forecast of future events, or a guarantee of future results. Forward-looking statements are subject to certain risks and uncertainties. Actual results, performance, or achievements may differ materially from those expressed or implied. Information is based on data gathered from what we believe are reliable sources. It is not guaranteed as to accuracy, does not purport to be complete and is not intended to be used as a primary basis for investment decisions. It should also not be construed as advice meeting the particular investment needs of any investor. Past performance does not guarantee future results.
Indices are unmanaged and investors cannot invest directly in an index. Unless otherwise noted, performance of indices does not account for any fees, commissions or other expenses that would be incurred. Returns do not include reinvested dividends.
The Standard & Poor’s 500 (S&P 500) Index is a free-float weighted index that tracks the 500 most widely held stocks on the NYSE or NASDAQ and is representative of the stock market in general. It is a market value weighted index with each stock’s weight in the index proportionate to its market value.
The Standard & Poor’s 500 Total Return Index (SPTR) is an unmanaged group of securities considered to be representative of the stock market that tracks capital appreciation as well as distributions. It is a market value weighted index with each stock’s weight in the index proportionate to its market value. The Total Return index assumes that all cash distributions (dividends and/or interest) are reinvested.
The S&P 500 Equal Weight Index provides exposure to the largest 500 public U.S. companies in the S&P 500 Index (a market value weighted index). However, each company is weighted at 0.2%, to provide more diversification and less concentration.
The S&P SmallCap 600 seeks to measure the small-cap segment of the U.S. equity market. The index is designed to track companies that meet specific inclusion criteria to ensure that they are liquid and financially viable.
The Nasdaq Composite Index is a market-capitalization weighted index of the more than 3,000 common equities listed on the Nasdaq stock exchange. The types of securities in the index include American depositary receipts, common stocks, real estate investment trusts (REITs) and tracking stocks. The index includes all Nasdaq listed stocks that are not derivatives, preferred shares, funds, exchange-traded funds (ETFs) or debentures.
The Consumer Price Index (CPI) is a measure of inflation compiled by the US Bureau of Labor Studies.
The MSCI ACWI Index is a free float‐adjusted market capitalization weighted index that is designed to measure the equity market performance of developed and emerging markets. The MSCI ACWI consists of 46 country indexes comprising 23 developed and 23 emerging market country indexes.


