Quarterly View: July 2025
Jul 15, 2025Listen to an abbreviated version of the commentary below here:
- Stocks rebounded during the second quarter, with the S&P 500 gaining 10.9% and ending the first half of 2025 at all-time highs.
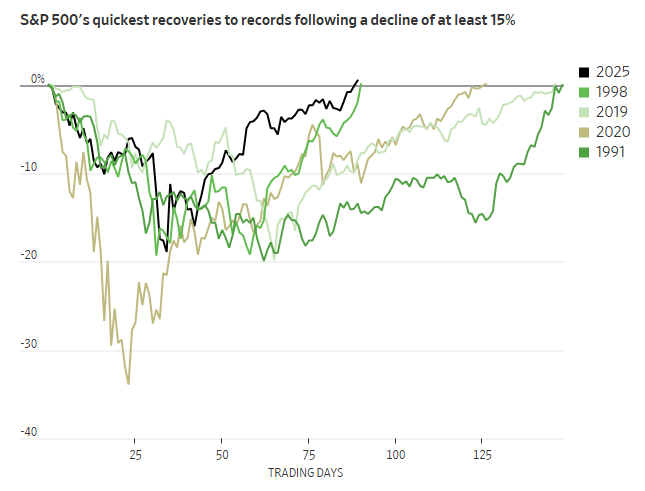
- The Trump administration’s approach to trade policy, including the announcements to set then pause reciprocal tariffs on specific countries, contributed to historic market volatility that saw stocks drop to near bear-market territory in early April and then snap back in one of their swiftest-ever recoveries.
- Bonds had an up-and-down quarter similar to stocks, with the Bloomberg U.S. Aggregate Bond Index rebounding from April lows to gain 1.2% for the period, as investors digested the impact of tariffs, conflict in the Middle East, and the possibility of higher budget deficits from the recently enacted tax and spending bill.
- The Federal Reserve held interest rates steady at its two meetings during the quarter, resisting pressure to ease rates as it assesses the impact of higher tariffs on inflation. The Fed did open the door for rate cuts later this year as current inflation readings remained subdued.
- We remain cautious but optimistic about the investment markets in the second half of the year, awaiting clarity on trade policy and anticipating a more favorable climate for businesses and investors that should support economic growth.
Second Quarter Review
The S&P 500 rose 10.9% in the second quarter of 2025, but the road to that impressive gain was anything but smooth. In fact, from the start it was straight downhill; the stock market dropped more than 10% over the four trading days between Trump’s April 2 Liberation Day tariff announcement and his April 9 pause on the highest country-specific reciprocal tariffs. Investors were already nervous about trade policy uncertainty, and stock markets were on weak footing, having just finished their worst quarter in over two years. The punitive tariffs, including a combined 54% tariff on Chinese imports, confirmed the market’s fears. The stock market’s slide pushed the S&P 500 to the edge of a bear market, only barely avoiding a 20% decline.
Source: The Wall Street Journal, Dow Jones Market Data
The tariff pause saved the day, and the market’s response was strong. The S&P 500 rose 9.5% on April 9 alone, its biggest one-day gain since October 2008, and began a recovery that erased all of its post-Liberation Day losses by May 2 and returned the index to positive territory for the year to date on May 13. By the end of June, the benchmark stock index was back at record-high levels, up 6.2% for the first half of the year.
Technology stocks were among the biggest beneficiaries of the trade-war détente, outpacing all other sectors and contributing the lion’s share of the S&P 500’s return for the quarter as growth stocks outperformed value and more defensive sectors. Despite recovering from their April lows, small-cap stocks, as measured by the Russell 2000 index, were down 1.8% for the year to date including dividends, widening the performance gap with their large-cap counterparts.

Source: YCharts
International stocks, as measured by the MSCI ACWI ex-USA index, continued their outperformance relative to U.S. stocks with a gain of 17.9% for the first half of the year as investors sought to diversify their exposure to turbulent U.S. markets. Beyond the stock market, the U.S. dollar declined due to the increase in demand for assets overseas.
Following the tariff pause on April 9, Trump and other administration officials seemed to take a more flexible approach to trade, toning down their aggressive statements and expressing a willingness to engage with trade partners in negotiations. This change of heart led to the first announced trade framework with the United Kingdom and productive discussions with China that de-escalated the trade war and lowered tariffs to around 32% on U.S. imports and around 51% on Chinese imports.
With the trade drama somewhat defused for the time being, investors brought their focus back to the fundamentals: economic growth and earnings. The U.S. economy demonstrated great resilience, although there were some signs that the tariff uncertainty was taking its toll on businesses and consumers. The U.S. gross domestic product (GDP) report for the first quarter showed a year-over-year decline of 0.5%. The main driver of the negative GDP number was a steep increase in imports as firms rushed foreign-made goods into the United States ahead of tariffs. Imports are a drag on economic growth because they detract from domestic production. This surge in imports is likely to be a one-time event, and future GDP reports may look better in comparison if higher tariffs lead to a drop in imports. However, lower consumer spending also weighed on economic activity.
Companies largely weathered the uncertainty in the first quarter. Earnings growth for S&P 500 firms came in at 13.3% year-over-year according to FactSet, the second-consecutive quarter of double-digit growth. Technology stocks in particular impressed with stellar earnings, primarily due to ongoing demand for artificial intelligence.
Source: YCharts
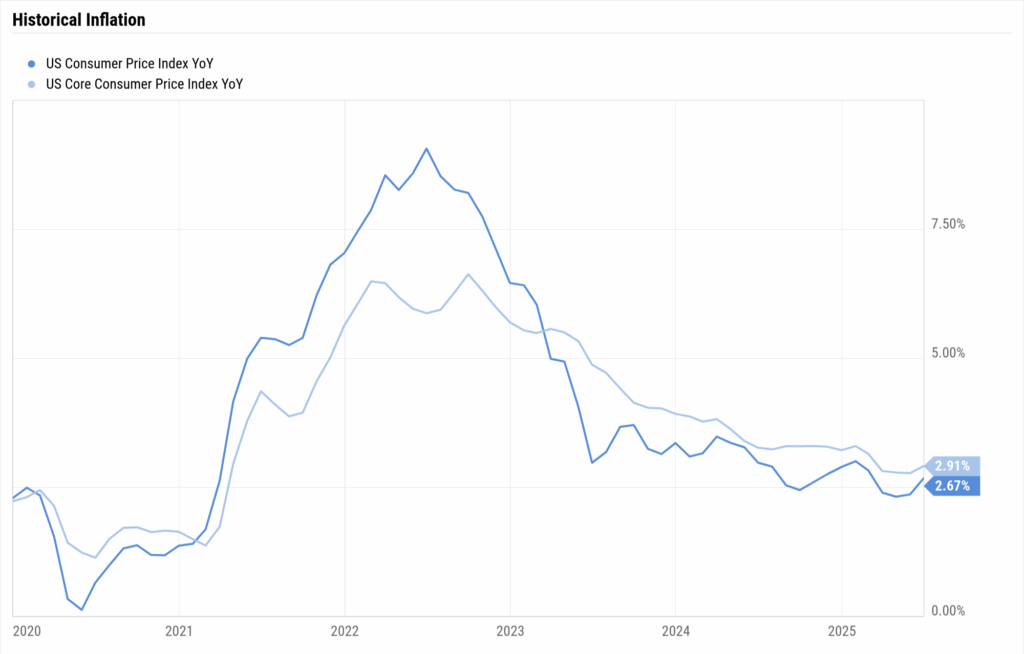
Elsewhere in the economy, business activity was mixed as retail sales declined, manufacturing remained in contraction, and services moderated. But employment continued to be a bright spot, with nonfarm payroll growth and the unemployment rates mostly holding steady throughout the quarter. Inflation reports have also been encouraging; the pace of growth in the Consumer Price Index has come down closer to the Federal Reserve’s 2.0% target level, hitting a year-over-year rate of 2.7% in June. Thankfully, we have not yet seen any inflationary impact from the tariff increases, as it seems companies have either absorbed the higher costs or consumers have shifted their spending more toward services, which are less impacted by tariffs and trade wars.
Source: YCharts
The improving inflation picture led to increased calls from Trump for Fed Chair Jerome Powell to lower interest rates and higher expectations from the markets of rate cuts in the second half of the year. The central bank’s rate-setting committee resisted this pressure, keeping the fed funds target rate in the 4.25-4.50% range. While the Fed seems committed to assessing the potential impact from tariffs on inflation before cutting rates, the door seems to be open for rate easing to resume shortly. Market expectations currently call for one rate cut in September, followed by a second in October.
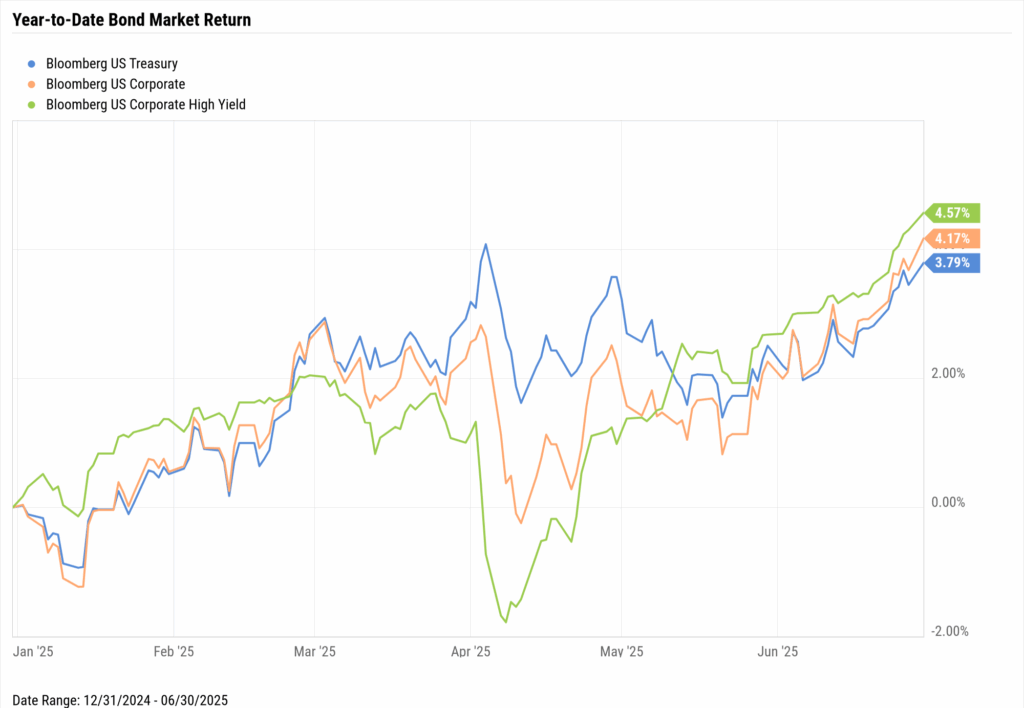
The prospect for lower rates buoyed investor sentiment and contributed to positive bond returns during the quarter. In addition to tariff headlines, investors had to assess the impact on bond yields from higher projected budget deficits from the tax and spending bill and a brief spike in oil prices from the rising conflict in the Middle East. Riskier corporate bonds outperformed Treasuries after a flight to quality during the first quarter.
Outlook
Early events in July may set the tone for what’s to come through the rest of the year. The first was the passage of the tax and spending bill on July 4, which made permanent the tax cuts from Trump’s first term, cut spending in some areas, and raised it in others. Most analysts estimate the budget deficit will widen because of the loss of tax revenue, leading to rising government debt and higher interest rates. While questions remain about the long-term impacts and costs of the bill, it does include business- and investor-friendly provisions that should create economic stimulus and give at least a short-term lift to markets.
While tax policy uncertainty appears to be resolved for the time being, trade policy is not. The 90-day tariff pause in April only prolonged uncertainty into July. However, with little progress made in securing trade deals as the July 9 deadline loomed, Trump agreed to extend the tariff pause to August 1. We are back where we were before April, with investors guessing at what the President’s next words and actions on tariffs will be and businesses reacting to developments rather than planning strategically for the future. Although Trump sent out letters to various countries outlining new proposed tariff rates, investors have largely dismissed this action as another one of his negotiating tactics to strike deals before the new imposed deadline.
We can, however, take confidence in the ability of the overall economy and companies to continue to weather the uncertainty. Businesses are on firmer ground thanks to their strong earnings results in recent quarters. Profit margins have remained high since firms raised prices at the outset of the COVID pandemic amid supply-chain troubles. These bigger margins should now help companies absorb higher costs from tariffs to maintain earnings growth, even if at a slower pace than recent quarters.
In summary, we are cautious but optimistic about prospects in the financial markets for the second half of the year. We expect the economy to continue to hum along as it has in recent months, absent any trade developments that would adversely impact business activity or consumer spending. The probability of Fed rate cuts in the next two quarters should keep the markets in good spirits, especially through the slow summer months and the typically volatile September-October period, but a surprise jump in inflation due to tariffs could scuttle all that. Uncertainty similar to today’s would usually weigh on stock prices, but we believe that the strength of the U.S. economy and more favorable business climate can continue to support markets and reward those who stay invested for the long term.
Disclosures
This material represents an assessment of the market and economic environment at a specific point in time and is not intended to be a forecast of future events, or a guarantee of future results. Forward-looking statements are subject to certain risks and uncertainties. Actual results, performance, or achievements may differ materially from those expressed or implied. Information is based on data gathered from what we believe are reliable sources. It is not guaranteed as to accuracy, does not purport to be complete and is not intended to be used as a primary basis for investment decisions. It should also not be construed as advice meeting the particular investment needs of any investor. Past performance does not guarantee future results.
Indices are unmanaged and investors cannot invest directly in an index. Unless otherwise noted, performance of indices does not account for any fees, commissions or other expenses that would be incurred. Returns do not include reinvested dividends.
The Standard & Poor’s 500 (S&P 500) Index tracks the 500 most widely held stocks on the NYSE or NASDAQ and is representative of the stock market in general. It is a market capitalization–weighted index with each stock’s weight in the index proportionate to its market value.
The Standard & Poor’s 500 Total Return Index (SPTR) is an unmanaged group of securities considered to be representative of the stock market that tracks capital appreciation as well as distributions. It is a market capitalization–weighted index with each stock’s weight in the index proportionate to its market value. The Total Return index assumes that all cash distributions (dividends and/or interest) are reinvested.
The MSCI ACWI Index is a market capitalization-weighted index that is designed to measure the equity market performance of developed and emerging markets. The MSCI ACWI consists of 46 country indexes comprising 23 developed and 23 emerging market country indexes.
The Bloomberg Barclays U.S. Aggregate Bond Index, or the Agg, is a broad base, market capitalization–weighted bond market index representing intermediate term investment grade bonds traded in the United States. Investors frequently use the index as a stand–in for measuring the performance of the U.S. bond market.
The Russell 2000 measures the performance of small capitalization U.S. stocks. The Russell 2000 is a market capitalization–weighted index of the 2,000 smallest stocks in the broad–market Russell 3000 Index.
The Consumer Price Index (CPI) is a measure of inflation compiled by the U.S. Bureau of Labor Statistics.