Quarterly View: April 2026
Apr 15, 2026Listen to an abbreviated version of the commentary below here:
- U.S. stocks declined to start the year, with the S&P 500 returning -4.3% in the first quarter, including dividends. The armed conflict in Iran and accompanying spike in oil prices from disruption throughout the Middle East rattled investors’ nerves and raised fears of renewed inflation and slower economic growth, a combination known as stagflation.
- Bonds were flat during the first quarter, with the Bloomberg U.S. Aggregate Bond Index returning -0.1%, as inflationary pressures tied to rising energy prices outweighed bonds’ typical appeal as safe-haven assets during periods of market volatility.
- The Federal Reserve held interest rates steady in January and March as largely expected, although uncertainty over the economic effects of the Iran conflict clouded the outlook for future monetary policy moves. Earlier in the quarter, market probabilities called for two Fed rate cuts in 2026, but by the end of March those expectations shifted out into 2027.
- We remain cautiously optimistic about opportunities in the financial markets for the year ahead, mindful of the short-term uncertainty created by higher oil prices and rising geopolitical tensions but confident in the resilience of the U.S. economy.
First Quarter Review
The dominant story of the first quarter of 2026 was the outbreak of armed conflict in Iran. The start of joint U.S.-Israeli airstrikes on Iranian military targets on February 28th set off retaliatory attacks throughout the region and led to the closure of the Strait of Hormuz, a critical shipping lane for the energy market. The subsequent spike in oil prices, seen in the rise of Brent crude from around $60 per barrel on January 1st to well over $100 by quarter-end, weighed heavily on global financial markets. Investors feared higher energy costs could re-ignite inflation and dampen growth, a combination known as stagflation. The current situation even drew comparisons to the stagflation years of the 1970s, when supply shocks caused by higher energy prices from the Arab oil embargo were catalysts for an ensuing market crisis.
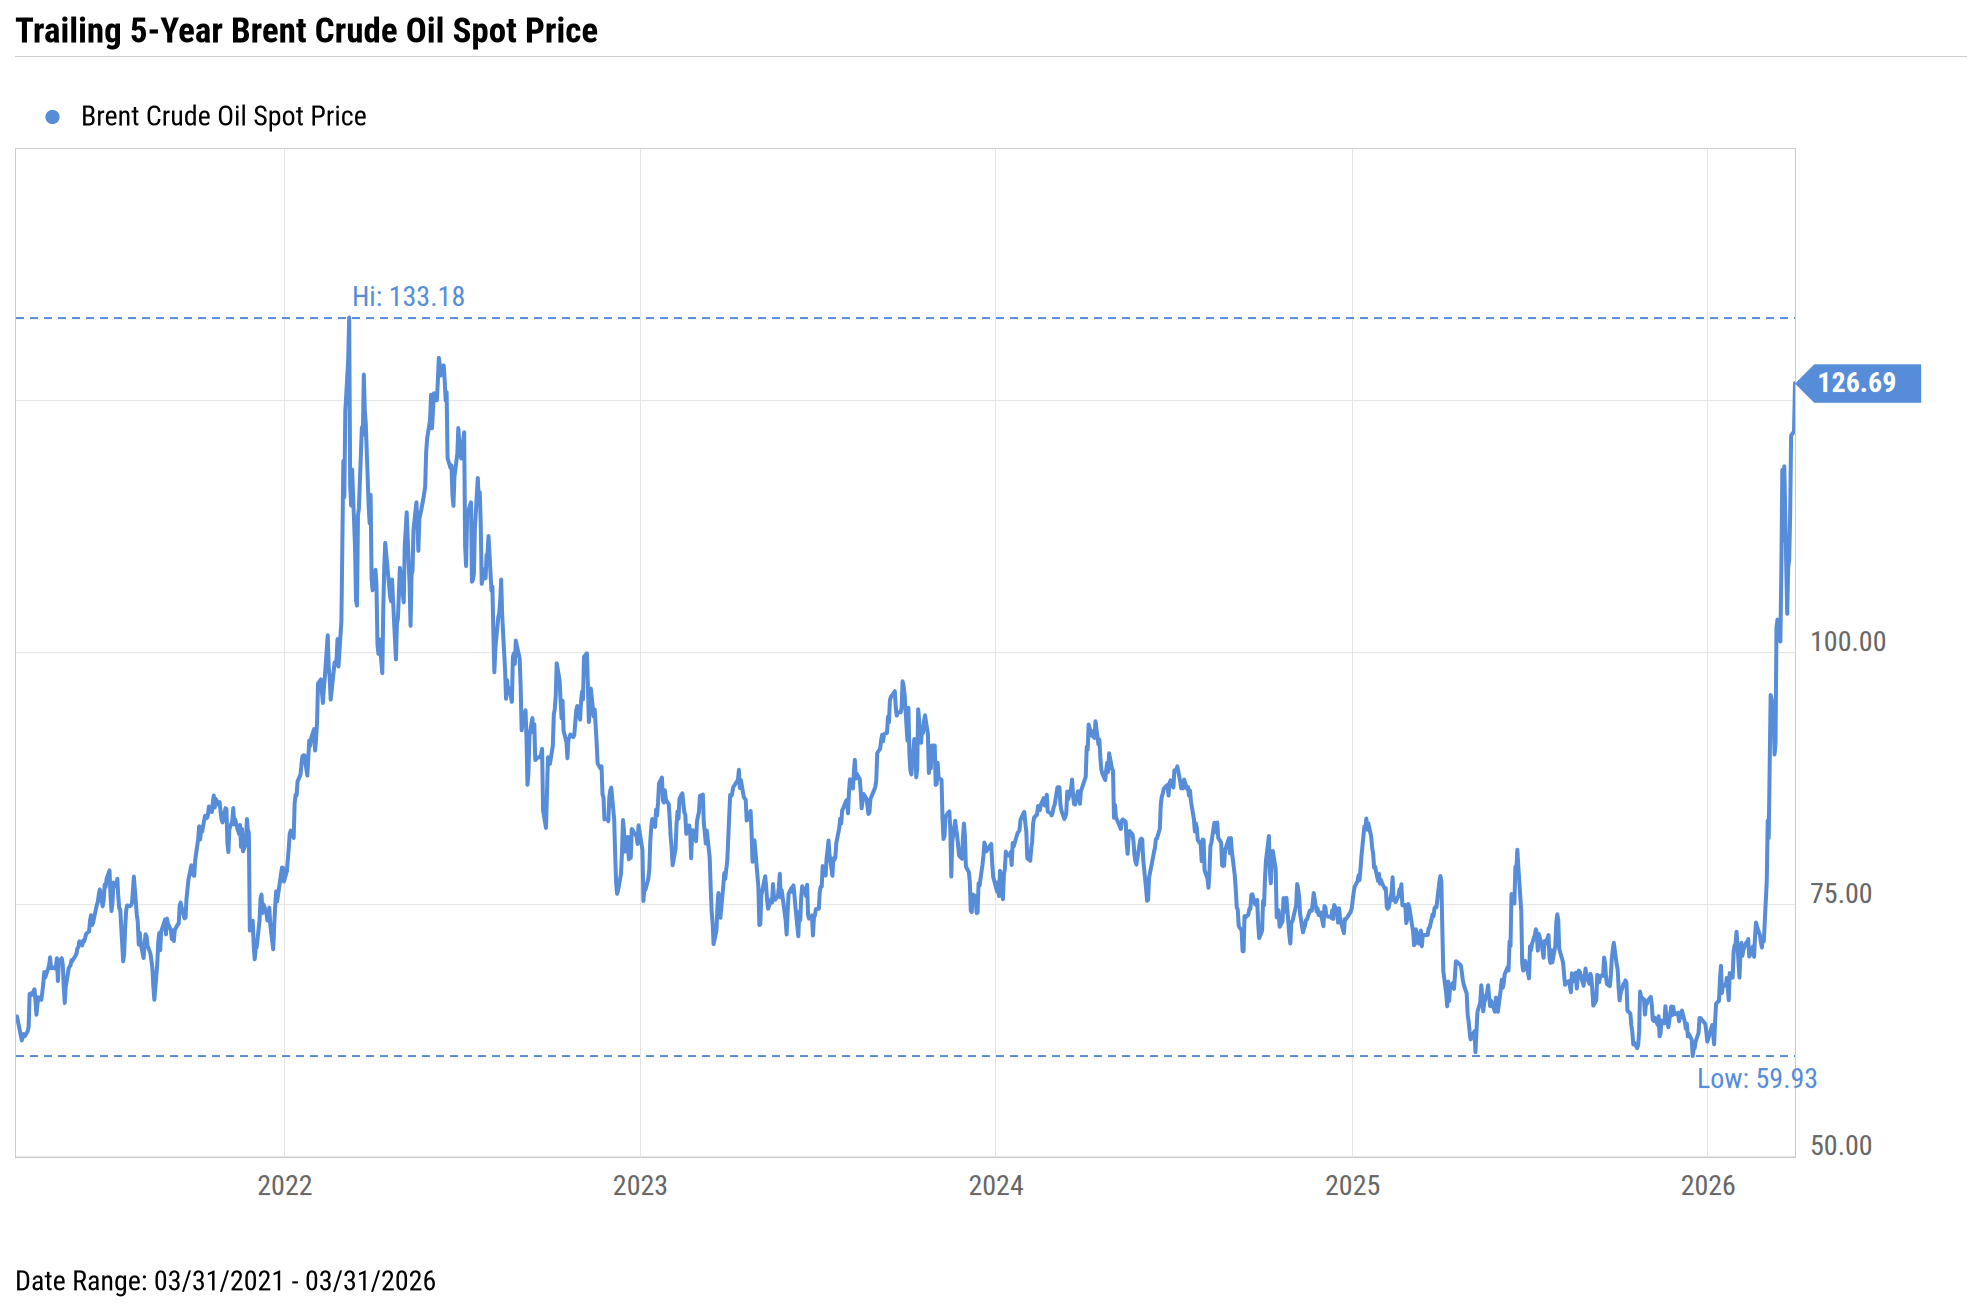
Source: YCharts
Despite the similarities, investors should recognize key distinctions between then and now. Most importantly, the United States is now a net oil exporter, making it less dependent on imports than it was in the 1970s. This shift could help shield the U.S. economy from the spike in energy prices and even benefit U.S. energy companies. Additionally, the U.S. economy has generally remained resilient in recent months despite uncertainty over trade policy and the rise in geopolitical tensions. Much of this resilience can be seen in corporate earnings, which remained strong and grew 14% for S&P 500 companies during the fourth quarter. Consumer spending has also held up well, particularly in services, buoyed by higher-income consumers whose wealth has increased due to strong financial market performance over the past few years.
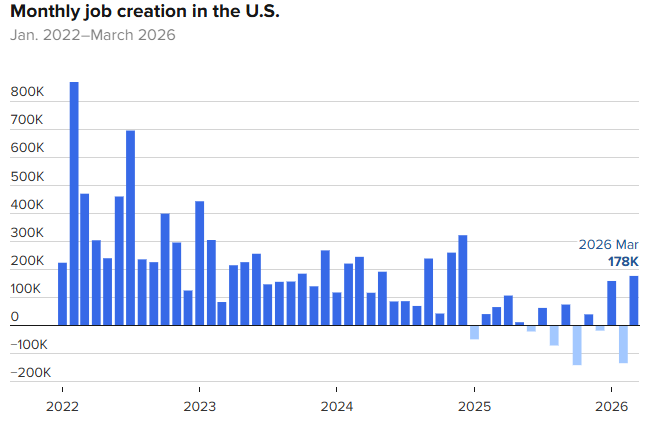
Source: CNBC, U.S. Bureau of Labor Statistics
However, there are soft spots that leave the U.S. economy vulnerable to a stagflation scenario. Job growth slowed dramatically during 2025, and employment remained patchy during the first quarter. Nonfarm payrolls alternated between gains and losses, averaging an increase of 68,000 jobs per month during the quarter. Although an improvement from the pace of monthly jobs gains in 2025, this increase is roughly half the amount of average monthly jobs created in 2024. Economists have described this as a low hire, low fire job market in which companies are reluctant to make any workforce decisions because of uncertainty over the economy. While the unemployment rate has continued to hover around 4%, the relative stability is largely due to a sharp decline in the labor force from restrictive immigration policies over the past few months.

Source: YCharts
Also consistent with a stagflation scenario, annual inflation has remained above the Fed’s 2% target for the past five years, and the latest March reading showed the Consumer Price Index (CPI) rising above 3% over the past twelve months due to the surge in energy prices. Core CPI, excluding food and energy, increased 2.6% from a year ago, indicating that underlying inflation is more contained for the time being. However, the current levels of inflation remain a sticking point for the Fed, which held interest rates steady at its two meetings during the quarter. Following the March meeting, Fed Chair Jerome Powell cited uncertainty over the economic impact of the Iran conflict as a primary reason for the Fed’s decision to pause monetary policy easing.
Source: YCharts
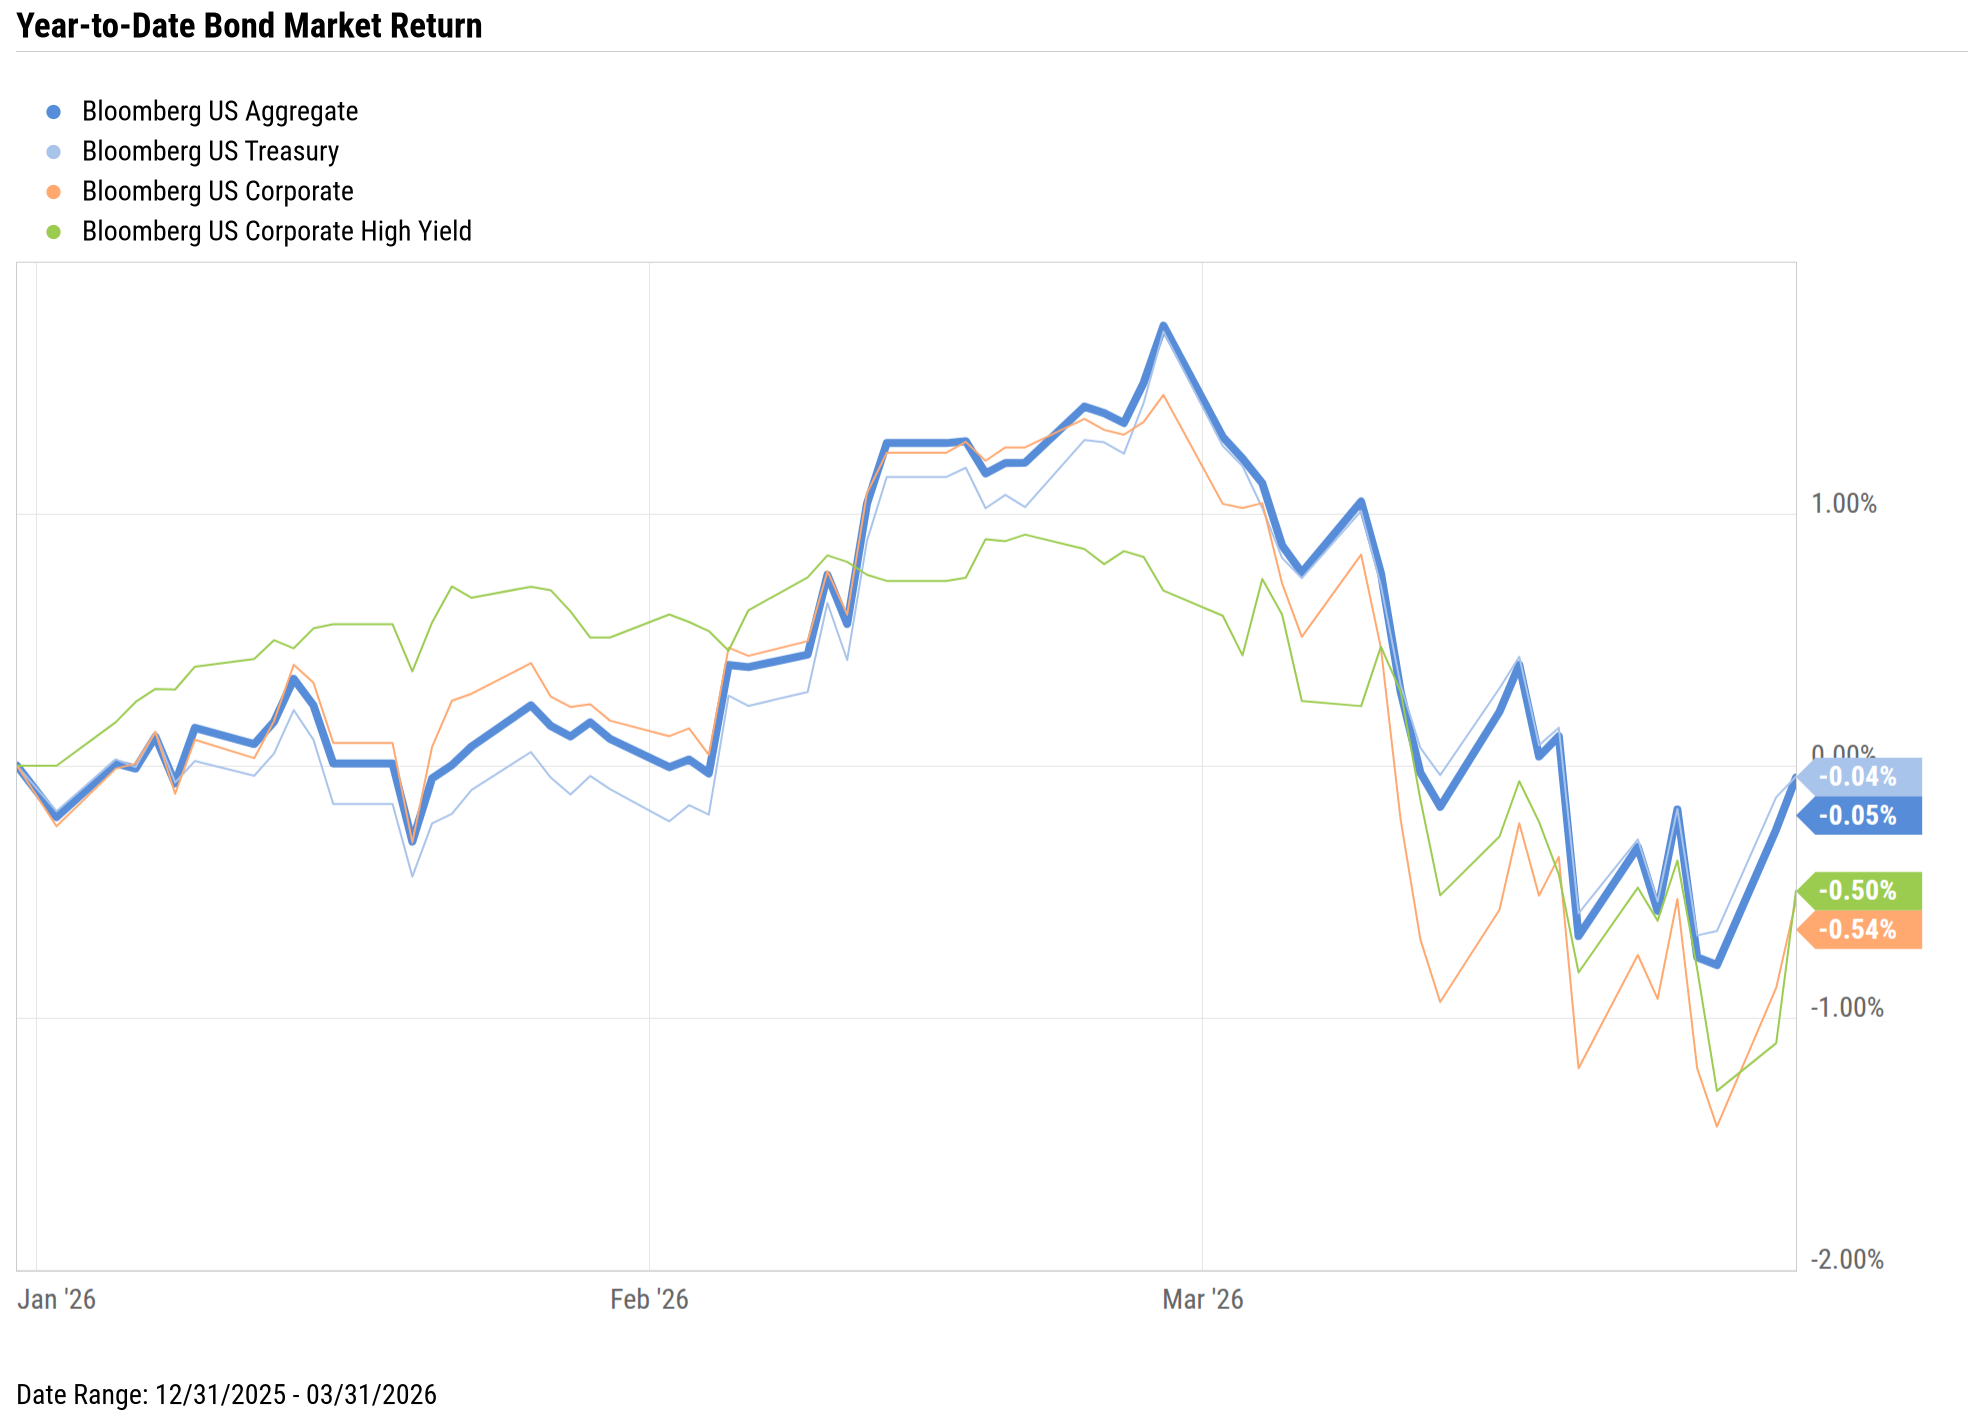
The likelihood of higher inflation led investors to downgrade expectations for future Fed rate cuts, from two quarter-point cuts at the start of the year to no cuts at all for 2026. Yields on the Fed-sensitive two-year Treasurys climbed at a faster pace than longer-term rates, reflecting growing uncertainty over the path of shorter-term interest rates. Bond returns were flat during the first quarter, with the Bloomberg U.S. Aggregate Bond Index returning -0.1%, even though investors typically drive bond prices higher during a flight to safety in times of geopolitical conflict and market volatility. Given the higher investor aversion to risk, corporate bonds underperformed U.S. Treasurys during the quarter.

Source: YCharts
Equity markets bore the brunt of the flight to safety in March as bearish sentiment took hold despite good fundamentals and a strong earnings season, with the S&P 500 losing 4.3%, including dividends, during the first quarter. Prior to the outbreak of the Iran conflict, stock performance was mixed, with value sectors outperforming as investors looked to reduce their technology exposure. The rotation from tech and growth stocks was prompted by fears of an artificial intelligence (AI)-driven disruption in software, thanks to the release of new AI models that investors feared could replace many of the business-related services these companies provide. The selloff in software stocks appeared to be based more on emotions than fundamentals, as many of these firms reported strong quarterly earnings and positive forward guidance for the coming year. Negative sentiment over AI-driven disruption even spread to alternative asset managers, as investors rushed to withdraw capital from funds perceived to have greater exposure to privately held software companies.
International and small-cap stocks were enjoying a strong quarter prior to March, handily outperforming the S&P 500, as investors sought to diversify from big tech and into more fairly valued areas of the market. However, as hostilities escalated in the Middle East, fears of a prolonged conflict and stagflation dragged down nearly all stocks except those in the energy sector. The tide turned strongly against international and emerging market equities, especially in many Asian countries that are more dependent on energy sources from the Gulf, with the MSCI ACWI ex-USA index giving up its gains during the first quarter and ending down 0.7%. Small-caps, as measured by the Russell 2000 index, gave up their earlier gains as well but managed to end the quarter up 0.9%, as the likelihood of less monetary easing and higher interest rates clouded the outlook for small-company earnings.
Outlook
The situation in the Middle East remains fluid and may even have changed by the time you read this. After the announcement of a two-week ceasefire on April 7th, U.S. stocks staged their largest single-day rally since last year’s Liberation Day rebound. However, with the United States and Iran still far apart in their demands, the peace talks broke down and the United States blockaded the Strait of Hormuz in a new showdown. The best-case scenario for investors is a speedy end to the conflict and a reopening of the Strait, allowing energy shipments to resume and prices to stabilize. The worst-case scenario is a drawn-out conflict in which regional energy supplies remain bottlenecked and energy prices stay elevated for longer than expected. Although the U.S. economy may be better insulated from the adverse impacts of higher-for-longer oil prices due to its energy independence, it is not immune to the risks of a global economic slowdown.
Despite the heightened risks and many uncertainties that investors face right now, we are still cautiously optimistic about the market outlook for the quarters ahead. The Iran conflict may have shaken investors from the complacency that had set in after several good years for stock market returns, previous periods of geopolitical conflict and stagflation have been temporary, and markets have eventually recovered from event-driven downturns. Should volatility continue to roil the market, we may find better opportunities to invest in high-quality companies at attractive valuations.
We believe the most effective approach during periods of uncertainty is to avoid over-reacting to short-term market movements and instead maintain a well-diversified portfolio with a long-term focus. History has consistently shown that financial markets offer great opportunities for patient investors to increase their wealth over time.
Disclosures
Glassy Mountain Advisors, Inc. is an independent investment adviser registered under the Investment Advisers Act of 1940, as amended. Registration does not imply a certain level of skill or training. More information about Glassy Mountain Advisors including our investment strategies, fees and objectives can be found in our ADV Part 2, which is available upon request.
This material represents an assessment of the market and economic environment at a specific point in time and is not intended to be a forecast of future events, or a guarantee of future results. Forward-looking statements are subject to certain risks and uncertainties. Actual results, performance, or achievements may differ materially from those expressed or implied. Information is based on data gathered from what we believe are reliable sources. It is not guaranteed as to accuracy, does not purport to be complete, and is not intended to be used as a primary basis for investment decisions. It should also not be construed as advice meeting the particular investment needs of any investor. Past performance does not guarantee future results.
Indices are unmanaged and investors cannot invest directly in an index. Unless otherwise noted, performance of indices does not account for any fees, commissions, or other expenses that would be incurred.
The S&P 500 index tracks the 500 most widely held stocks on the NYSE or NASDAQ and is representative of the stock market in general. It is a market capitalization–weighted index with each stock’s weight in the index proportionate to its market value.
The S&P 500 Total Return index tracks capital appreciation as well as distributions. It is a market capitalization–weighted index with each stock’s weight in the index proportionate to its market value. The Total Return index assumes that all cash distributions (dividends and/or interest) are reinvested.
The Bloomberg Barclays U.S. Aggregate Bond Index, or the Agg, is a broad-based, market capitalization–weighted bond market index representing intermediate term investment grade bonds traded in the United States. Investors frequently use the index as a stand–in for measuring the performance of the U.S. bond market.
The Russell 2000 index measures the performance of small capitalization U.S. stocks. The Russell 2000 index is a market capitalization–weighted index of the 2,000 smallest stocks in the broad–market Russell 3000 index.
The MSCI ACWI ex USA Index is a free float-adjusted market capitalization-weighted index that is designed to measure the equity market performance of developed and emerging markets, excluding the United States. The MSCI ACWI ex USA Index captures large and mid cap representation across 22 of the 23 developed markets, including Australia, Austria, Belgium, Canada, Denmark, Finland, France, Germany, Hong Kong, Ireland, Israel, Italy, Japan, the Netherlands, New Zealand, Norway, Portugal, Singapore, Spain, Sweden, Switzerland and the United Kingdom; and 26 emerging markets, including Argentina, Brazil, Chile, China, Colombia, Czech Republic, Egypt, Greece, Hungary, India, Indonesia, Korea, Malaysia, Mexico, Pakistan, Peru, the Philippines, Poland, Russia, Qatar, Saudi Arabia, South Africa, Taiwan, Thailand, Turkey and United Arab Emirates. With over 2,000 constituents, the Index covers approximately 85% of the global equity opportunity set outside the United States.
The Consumer Price Index (CPI) is a measure of inflation compiled by the U.S. Bureau of Labor Statistics.