Q3 2026 Market Review: Stocks, Bonds, Inflation & Outlook
Oct 22, 2026Listen to an abbreviated version of the commentary below here:
U.S. stocks rose in the third quarter with a modest gain of 2.3% for the S&P 500, including dividends. Despite pressures from rising energy prices, persistent inflation, and Federal Reserve rate tightening, investors focused on the resilience of the U.S. economy and impressive corporate earnings results, especially from technology and artificial intelligence (AI)-related companies.
Bonds sold off as long-term interest rates climbed to levels not seen in 24 years. The Bloomberg U.S. Aggregate Bond Index dropped 3.5% for the quarter while the 10-year Treasury rate hit 5.3% by the end of September as inflation fears and mounting federal government debt helped fuel the bond market rout.
The Federal Reserve raised interest rates by a quarter-point in September as recent inflation figures compelled the Fed to act. Additionally, many Fed governors appeared supportive of at least one additional rate hike to come before year end.
We remain cautiously optimistic about opportunities in the financial markets, anticipating the stock market will carry its momentum through the end of the year supported by strong corporate earnings and robust investment in AI. Meanwhile, the recent bond market sell-off has pushed yields back toward attractive levels, presenting potential opportunities for long-term investors who are willing to tolerate near-term volatility.
Third Quarter Review
Both the stock market and the U.S. economy faced challenges in the third quarter. Energy market volatility from ongoing hostilities in the Persian Gulf, rising inflation, higher interest rates, and a hawkish shift at the Federal Reserve all weighed on investor sentiment. Despite these pressures, the economy continued to grow and stocks climbed higher, with the S&P 500 setting new record highs during the summer months. Much of the strength was due to fundamental factors such as robust business activity and stellar earnings growth, both positive signs from an investment perspective. At the end of September, U.S. real gross domestic product growth for the second quarter was revised higher to an annualized rate of 2.2%, up from the initial estimate of 1.5%, with both private investment and consumer spending helping propel the ongoing expansion. Companies also reaped the rewards of the resilient economy, with second quarter earnings for the S&P 500 surging an impressive 52% year-over-year, according to FactSet. While this figure was inflated by significant unrealized gains reported by Alphabet and Amazon as their investments in high profile startups paid off, earnings still grew by more than 30% year-over-year excluding these two outliers.
AI Investment Continues to Drive Market Growth
The AI buildout continues to be a key catalyst driving the stock market and U.S. economy higher. Although some investors have expressed concern about the market’s heavy reliance on AI-related investments, the benefits of this robust spending are extending beyond the technology sector. Businesses across a broad range of industries, particularly those involved in constructing, powering, and equipping data centers, are enjoying a surge in demand as companies invest heavily in the infrastructure needed to support AI’s expansion.
U.S. Large Cap Stocks Outperform During the Third Quarter
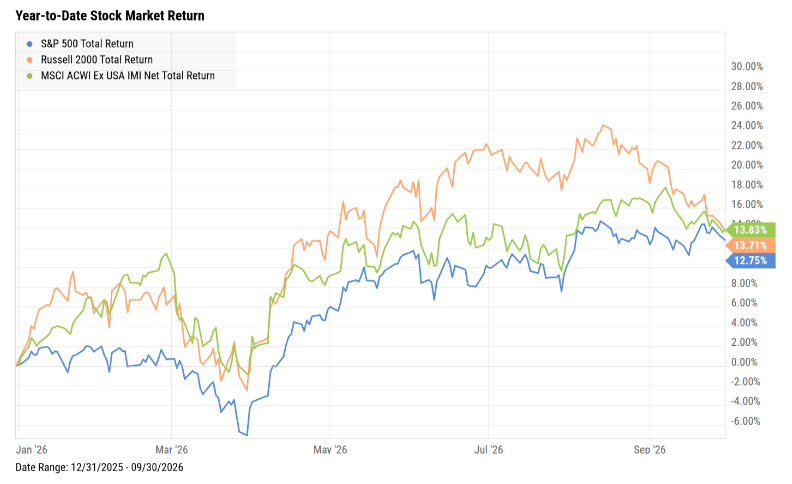
The S&P 500 returned 2.3% during the third quarter, bringing its year-to-date gain to 12.7%, including dividends. While investor enthusiasm for technology and AI-related stocks has remained strong throughout the year, energy stocks benefited from higher oil prices and pulled ahead during the third quarter, making energy the best performing sector so far this year in the S&P 500.
Source: YCharts
U.S. small-cap stocks, as measured by the Russell 2000 index, and international stocks, as measured by the MSCI ACWI ex-USA index, underperformed during the third quarter, narrowing their year-to-date lead over the S&P 500. U.S. small cap stocks sold off during the quarter as investors worried about the impact of higher rates on small-company earnings. Meanwhile, international stocks were mixed as investors weighed the benefits of strong demand for semiconductors and other data center components, particularly in emerging markets, against renewed concerns that most international economies outside the United States are more reliant on energy sources from the Persian Gulf.
Source: YCharts
Rising Energy Prices Fuel Inflation Concerns
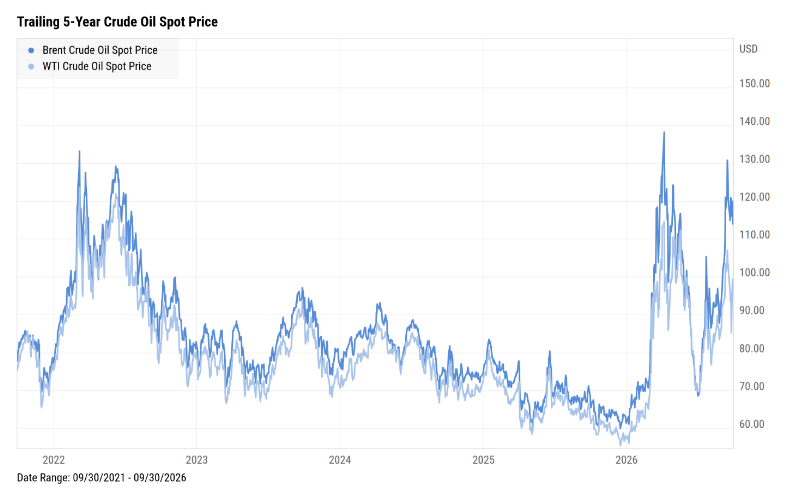
Higher energy prices resurfaced as a key risk during the third quarter, with oil prices spiking above $100 per barrel in September. Hostilities between the United States and Iran escalated once again, and the prospect for peace talks between the two countries seemed remote as the quarter came to an end. Businesses reported higher input costs that were almost entirely due to transportation, particularly as diesel prices reached all-time highs. Consumers also battled higher gas prices throughout the summer driving season, although the resilient labor market helped to ease some of this pressure as Americans continued to drive and spend.
Federal Reserve Raises Interest Rates as Inflation Persists
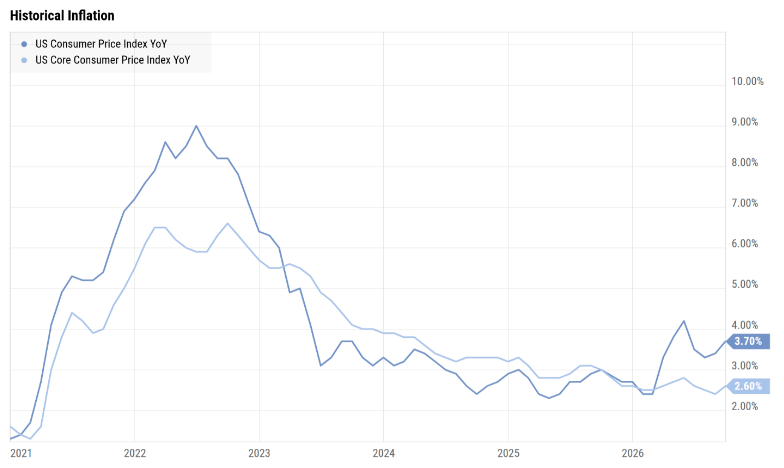
Naturally, the spike in energy prices flowed into the monthly inflation reports. Consumer-price inflation stood at an elevated annual rate of 3.7% in September, with gas prices rising 34% year-over-year and accounting for half of the month’s increase in inflation. Persistent inflation pressures during the third quarter gave the Federal Reserve ample reason to raise the federal funds rate by a quarter-point in September. The rate hike was largely expected by the market in the days leading up to the meeting, but the unanimous vote by the Fed’s rate-setting committee was notable. Many Fed governors also appeared to favor at least one more rate hike before year-end.
Source: YCharts
Investors seemed to welcome the clarity provided by the Fed in its decision to act on the rising inflation pressures, after having to adapt to new Fed chair Kevin Warsh’s tight-lipped approach to communication. Additionally, some market participants read the Fed’s hawkish turn as a signal of confidence that the U.S. economy and labor market are strong enough to withstand higher rates while the Fed attempts to pre-emptively fight inflation. Although rate hikes are usually the right tool to tame inflation, they have historically been more effective in curbing demand than addressing the type of supply-driven price shocks that are currently fueling inflation. The limitations of monetary tightening might become more evident if energy prices stay elevated, particularly as core consumer price inflation, which excludes food and energy prices, has already moderated near five-year lows.

Source: YCharts
Bond Markets Struggle as Treasury Yields Reach Multi-Decade Highs
The bond market had its own say about inflation, pushing longer-term interest rates to multi-decade highs. By quarter-end, the benchmark 10-year U.S. Treasury rate had reached 5.3%, while the 30-year Treasury rate neared 5.6%, levels last seen 24 years ago. It was one of the sharpest moves bond investors have experienced in recent memory, with the impact depressing the values of both U.S. government and corporate bonds. The Bloomberg U.S. Aggregate Bond Index dropped 3.5% during the third quarter, wiping out earlier gains and bringing its year-to-date return to a loss of 2.9%.

Source: YCharts
Beyond inflation, bond investors have also grown more concerned about the rising U.S. federal government debt, which hit a record $40 trillion in August. Furthermore, a surge in new investment-grade corporate debt issuance this year, largely driven by technology firms financing their AI investments, has added additional competition for Treasurys and put upward pressure on bond yields.
Market Outlook for the Remainder of 2026
AI Investment and Higher Bond Yields Present Opportunities
We continue to be cautiously optimistic about the stock market as the end of 2026 approaches. The pace and scale of the AI investment boom shows little sign of slowing, providing the continued momentum that could help the S&P 500 deliver a fourth-straight year of double-digit returns. Higher bond yields have created more attractive income opportunities, but the risk of further interest rate volatility remains elevated in the near-term.
Inflation and Federal Reserve Policy Remain Key Risks
The key factor to watch in the coming months will be inflation, particularly the direction of energy prices. If tensions between the United States and Iran ease and energy prices retreat, then inflation fears will likely subside. However, if energy prices and inflation remain elevated, the Fed could face a difficult balancing act between fighting inflation and sustaining economic growth. Additional rate hikes will hit rate-sensitive sectors like autos and housing, which are already soft, and add to the mounting price pressures the U.S. consumer is facing, while doing little to slow the AI-driven parts of the economy that have been supported by large tech firms that have the cash flow and balance sheet flexibility to continue finance their AI expenditures without having to borrow heavily.
How the Midterm Elections Could Influence Markets
Finally, the midterm election cycle is on the horizon. While political outcomes have little influence on longer-term investment performance, the results can influence near-term market sentiment. Investors have had to deal with much D.C.-related drama over the past two years, including trade and geopolitical turmoil. If the midterms flip the power structure to a partisan split, the result could mean fewer headlines to roil the markets. Investors may appreciate the relative calm that political gridlock can provide.
Disclosures:
Glassy Mountain Advisors, Inc. is an independent investment adviser registered under the Investment Advisers Act of 1940, as amended. Registration does not imply a certain level of skill or training. More information about Glassy Mountain Advisors including our investment strategies, fees and objectives can be found in our ADV Part 2, which is available upon request.
This material represents an assessment of the market and economic environment at a specific point in time and is not intended to be a forecast of future events, or a guarantee of future results. Forward-looking statements are subject to certain risks and uncertainties. Actual results, performance, or achievements may differ materially from those expressed or implied. Information is based on data gathered from what we believe are reliable sources. It is not guaranteed as to accuracy, does not purport to be complete, and is not intended to be used as a primary basis for investment decisions. It should also not be construed as advice meeting the particular investment needs of any investor. Past performance does not guarantee future results.
Indices are unmanaged and investors cannot invest directly in an index. Unless otherwise noted, performance of indices does not account for any fees, commissions, or other expenses that would be incurred.
The S&P 500 index tracks the 500 most widely held stocks on the NYSE or NASDAQ and is representative of the stock market in general. It is a market capitalization–weighted index with each stock’s weight in the index proportionate to its market value.
The S&P 500 Total Return index tracks capital appreciation as well as distributions. It is a market capitalization–weighted index with each stock’s weight in the index proportionate to its market value. The Total Return index assumes that all cash distributions (dividends and/or interest) are reinvested.
The Bloomberg U.S. Aggregate Bond Index, or the Agg, is a broad-based, market capitalization–weighted bond market index representing intermediate term investment grade bonds traded in the United States. Investors frequently use the index as a stand–in for measuring the performance of the U.S. bond market.
The Russell 2000 index measures the performance of small capitalization U.S. stocks. The Russell 2000 index is a market capitalization–weighted index of the 2,000 smallest stocks in the broad–market Russell 3000 index.
The MSCI ACWI ex USA Index captures large and mid cap representation across Developed Markets (DM) countries (excluding the US) and Emerging Markets (EM) countries. The index covers approximately 85% of the global equity opportunity set outside the United States.
The Consumer Price Index (CPI) is a measure of inflation compiled by the U.S. Bureau of Labor Statistics.