Quarterly View: October 2025
Oct 15, 2025Listen to an abbreviated version of the commentary below here:
- Stocks continued to rise throughout the third quarter to record levels, with the S&P 500 gaining 8.1%, including dividends, in another strong period for investors. Bonds also notched another positive quarter, with the Bloomberg U.S. Aggregate Bond Index returning 2.0%.
- Throughout the quarter, markets grew optimistic about the resumption of Federal Reserve monetary easing, which eventually arrived with a quarter-point rate cut in September.
- Labor market weakness, evidenced by poor jobs reports for July and August, was the primary catalyst for the Fed’s decision to lower rates. Fed Chair Jerome Powell noted the shift in risks from inflation to employment, even as recent reports showed inflation ticking upwards.
- Technology stocks contributed to over half of the S&P 500’s quarterly return, powered by renewed investor optimism for artificial intelligence (AI)-related stocks. Small-capitalization stocks and emerging market stocks also outperformed on rising expectations for Fed rate cuts.
- We remain optimistic that markets can carry their momentum into the fourth quarter, but we are cautious about the uncertainties around employment and inflation, as they could impact future Fed decisions on interest rates and cause investors to reassess their rosy outlooks. Trade developments may also return to the spotlight in November as the United States and China work toward a trade deal and the Supreme Court has a chance to weigh in on the legality of Trump’s tariffs.
Third Quarter Review
The S&P 500 rose 8.1%, including dividends, in the third quarter as the major stock market indices reached new all-time highs and investors enjoyed another quarter of healthy returns. Last quarter’s uncertainty around tariffs and trade policy eased for the most part as the market appeared to grow comfortable with lower-than-feared effective tariff rates. Instead, attention turned to the Federal Reserve and the prospects for rate cuts in the second half of the year. After holding rates steady in July, the Fed lowered the federal funds rate by ¼% in September, the first rate cut this year. Fed Chair Jerome Powell also left the door open for two more rate cuts in the final quarter, describing current monetary policy as modestly restrictive.
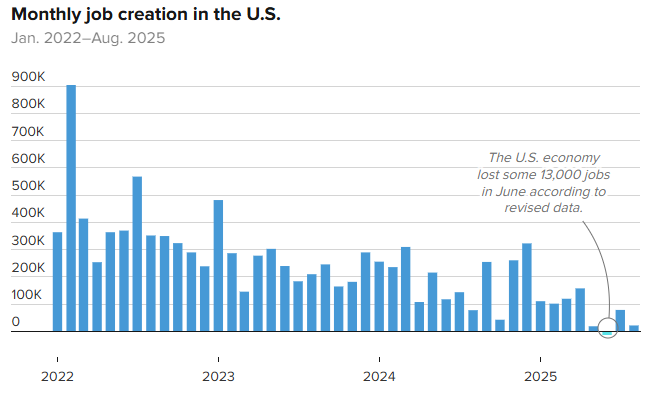
Source: CNBC, U.S. Bureau of Labor Statistics
The biggest factor in the Fed’s decision to lower interest rates in September was the appearance of cracks in the job market. Doubts first surfaced in the July jobs report, which showed a significant slowdown in hiring with just 73,000 new jobs for the month and sharp revisions for the previous two months. The August report was worse, with an even fewer 22,000 jobs added to nonfarm payrolls and further downward revisions to past data. The numbers weakened the prevailing narrative of labor market resilience and increased expectations for the Federal Reserve to lower rates in short order to prevent a further slowdown.

Source: YCharts
However, that decision was not so clear cut; sustained inflation pressures throughout the summer put Fed officials in a bind between responding to employment market weakness and keeping the lid on rising prices. The August Consumer Price Index report showed year-over-year inflation rose back near its high for the year, reversing much of the progress made over the past several months. Eventually, remarks by Jerome Powell at the Fed’s Jackson Hole summit in August clarified the central bank’s near-term outlook on interest rates. In the Fed’s view, the balance of risks to the economy had shifted from inflation to employment, even as consumer price growth moved farther away from the Fed’s 2% target, and necessitated renewed monetary easing.
The current consensus around President Trump’s increased tariffs is that they have not had as much of an impact on inflation as many economists had feared. So far, the effect appears to be minimal, with just modest upticks in inflation, but an overall effective tariff rate of 18%—the highest level since 1934—is a huge increase from the 2-3% effective rate at the start of the year.
As the last few days have highlighted, any trade escalation between the United States and China can cause markets to quickly reassess their tariff assumptions. While both sides seemed to be working towards a deal over the summer after agreeing to pause reciprocal tariffs until mid-November, China’s restrictions on rare earth materials and Trump’s threat of new significant tariffs showed that discussions are still fluid. To add to the uncertainty of U.S. trade policy, the Supreme Court will have a chance to weigh in on the legality of Trump’s tariffs when hearings begin in November.
Although tariffs should continue to flow through the U.S. economy, companies have temporarily dampened the impact of the higher rates by cutting costs and drawing down inventories they had built up in advance of Trump’s tariff announcements, reducing the impact of tariffs on consumers. Higher tariffs have also not had much impact yet on company earnings, which in the second quarter grew at a double-digit year-over-year rate for the third-consecutive quarter, according to FactSet. The resilience of corporate results helped to bolster equity returns this past quarter, especially for those technology firms that have continued to deliver strong earnings and lead the market to record heights.
Tech stocks have been rising not only on optimism around AI but on actual demand for the hardware and datacenters that power AI applications. Announcements of multi-billion dollar deals from major tech firms that are investing heavily in the AI buildout continued to surprise investors and highlighted that the spending spree may be far from over. However, as valuations continued to climb for AI-related stocks, some investors began to question the rich valuations and draw similarities to previous tech bubbles. If businesses and consumers take longer than expected to adopt AI, the recent enthusiasm could turn into concern about the massive spending on AI infrastructure, leaving tech and AI stocks vulnerable to near-term weakness.
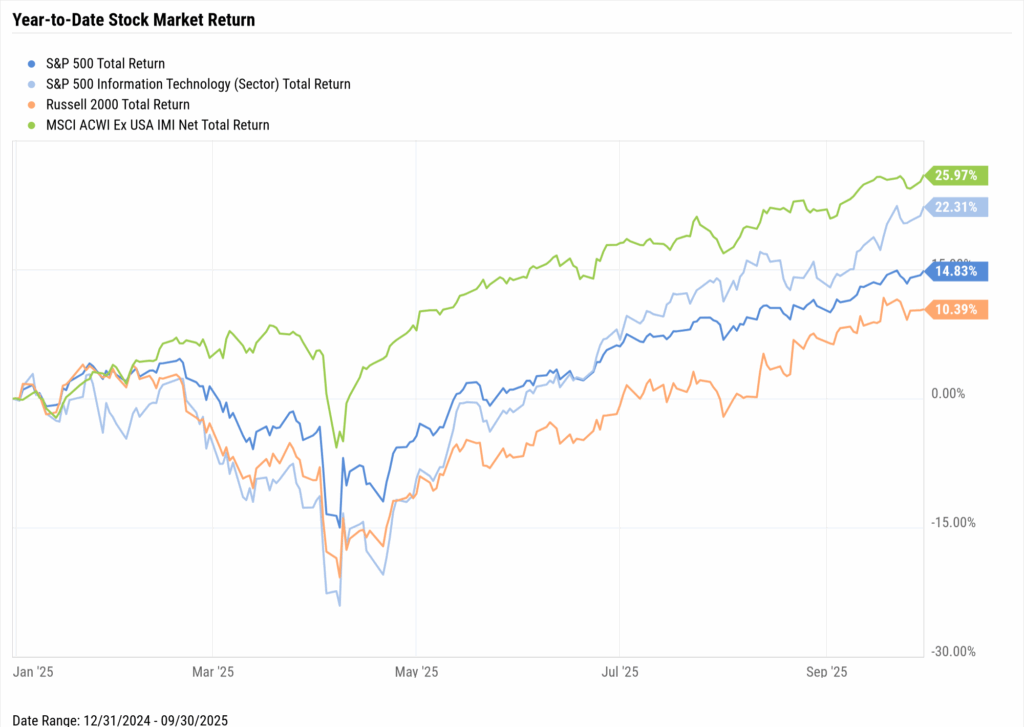
Source: YCharts
Beyond large tech and AI stocks, small-company stocks shone this past quarter, with the small-capitalization Russell 2000 Index gaining 12.4% and narrowing the performance gap with the S&P 500 for the year to date. Smaller firms generally rely more on borrowing to raise capital, and lower interest rates are seen as beneficial to their bottom lines, so projections for more Fed rate easing brightened the prospects for small-company stocks.
International stocks cooled a bit in the third quarter as gains in tech stocks swung the momentum back to U.S. markets. However, international stocks, as measured by the MSCI ACWI ex-USA index, remained in favor as they continued to outpace the S&P 500 for the year to date. Emerging markets were a bright spot on the global stage during the quarter, outperforming developed international equity markets, as Chinese stocks rallied on the extension of the U.S. China tariff pause.
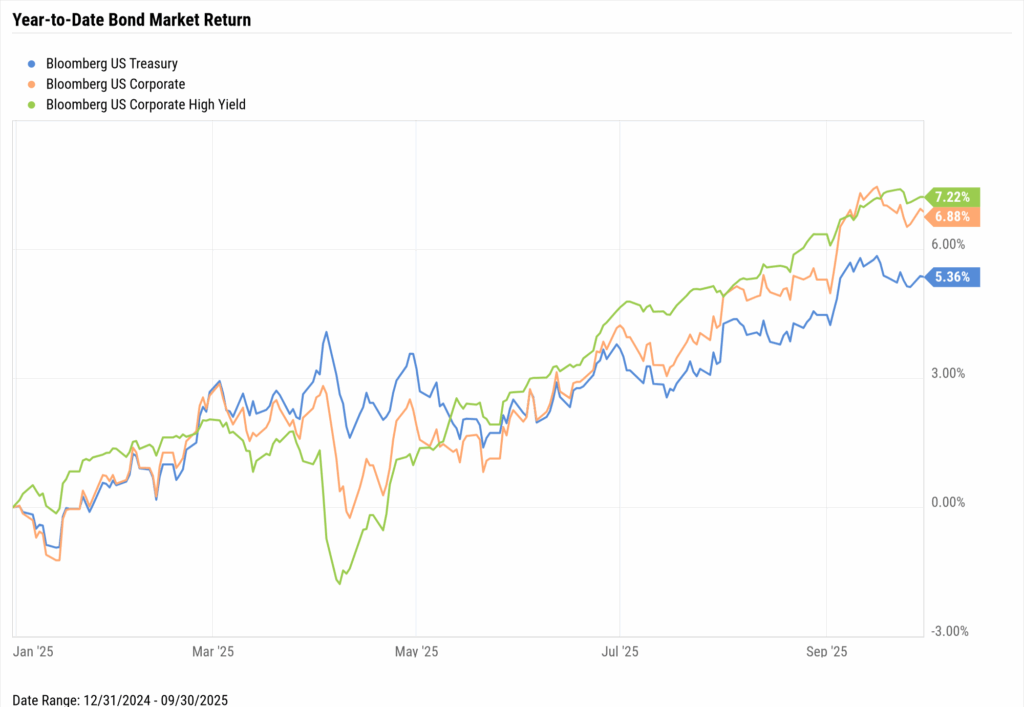
Source: YCharts
Longer-term interest rates moved gradually downward during the quarter as the likelihood of Fed rate cuts grew. The benchmark 10-year U.S. Treasury rate sat near 4.5% in mid-July but finished September lower at 4.2%. Yields on investment-grade and high yield corporate bonds also fell and their spreads relative to U.S. Treasuries narrowed as investors grew more optimistic for continued economic growth supported by easing monetary policy. The across-the-board decline in yields led to positive bond returns for the quarter as bond prices moved higher.
Outlook
We are writing this quarterly review just as the latest federal government shutdown unfolds. At this time, the White House and Congressional Democrats are far apart on an agreement that would continue to fund government operations, so we don’t know when or how this shutdown will end. Both equity and bond markets appear to be shrugging off the potential risks for the moment, perhaps with an understanding of how the markets fared in past shutdowns. The last one, during President Trump’s first term, was the longest in recent history, lasting 34 days. Stocks performed well during this brief period, but more importantly continued to rise over the months that followed.
A government shutdown affects more than just stock prices, and investors should be attuned to other negative consequences. The risk of employment furloughs and job losses is significant and would come at an inopportune time, when the private-sector job market seems to be faltering. On top of that, inflation pressures have re-entered the picture with the potential impact from tariffs on consumer prices still undetermined. These changing dynamics could factor into upcoming Federal Reserve decisions on interest rates, perhaps more so in 2026.
The road ahead for the Fed is difficult and will have investors tuning into every future economic report on jobs and inflation to gauge what path the central bank may take on interest rates. More rate cuts, which is what markets are currently expecting, would point to a weaker jobs market and slowing U.S. economy that needs stimulus to shore up demand. On the other hand, resurgent inflation would likely test the Fed’s patience, and any rate increase could have markets fretting about the Fed’s backtracking on rate cuts.
Independent of the Fed’s actions, the resilience of U.S. businesses and their ability to deliver results in a difficult economic climate is a source of encouragement. Companies have shown recently they can manage through trade and tariff uncertainties, and many are in good financial position to continue doing so. Despite the various near-term challenges, we believe that well-run businesses in growing markets should provide attractive opportunities for investors who remain disciplined and focused on the long term.
Disclosures
This material represents an assessment of the market and economic environment at a specific point in time and is not intended to be a forecast of future events, or a guarantee of future results. Forward-looking statements are subject to certain risks and uncertainties. Actual results, performance, or achievements may differ materially from those expressed or implied. Information is based on data gathered from what we believe are reliable sources. It is not guaranteed as to accuracy, does not purport to be complete and is not intended to be used as a primary basis for investment decisions. It should also not be construed as advice meeting the particular investment needs of any investor. Past performance does not guarantee future results.
Indices are unmanaged and investors cannot invest directly in an index. Unless otherwise noted, performance of indices does not account for any fees, commissions or other expenses that would be incurred. Returns do not include reinvested dividends.
The Standard & Poor’s 500 (S&P 500) Index tracks the 500 most widely held stocks on the NYSE or NASDAQ and is representative of the stock market in general. It is a market capitalization–weighted index with each stock’s weight in the index proportionate to its market value.
The Standard & Poor’s 500 Total Return Index (SPTR) is an unmanaged group of securities considered to be representative of the stock market that tracks capital appreciation as well as distributions. It is a market capitalization–weighted index with each stock’s weight in the index proportionate to its market value. The Total Return index assumes that all cash distributions (dividends and/or interest) are reinvested.
The Bloomberg Barclays U.S. Aggregate Bond Index, or the Agg, is a broad base, market capitalization–weighted bond market index representing intermediate term investment grade bonds traded in the United States. Investors frequently use the index as a stand–in for measuring the performance of the U.S. bond market.
The Russell 2000 measures the performance of small capitalization U.S. stocks. The Russell 2000 is a market capitalization–weighted index of the 2,000 smallest stocks in the broad–market Russell 3000 Index.
The MSCI ACWI Index is a market capitalization-weighted index that is designed to measure the equity market performance of developed and emerging markets. The MSCI ACWI consists of 46 country indexes comprising 23 developed and 23 emerging market country indexes.
The Consumer Price Index (CPI) is a measure of inflation compiled by the U.S. Bureau of Labor Statistics.
Glassy Mountain Advisors, Inc. is an independent investment adviser registered under the Investment Advisers Act of 1940, as amended. Registration does not imply a certain level of skill or training. More information about Glassy Mountain Advisors including our investment strategies, fees and objectives can be found in our ADV Part 2, which is available upon request.