Quarterly View: July 2026
Jul 16, 2026Listen to an abbreviated version of the commentary below here:
- U.S. stocks rebounded in the second quarter with a gain of 15.2% for the S&P 500, including dividends. Despite the ongoing conflict in Iran and inflationary pressures from elevated energy prices, investors focused on stellar earnings results, particularly from technology companies that contributed significantly to stock market returns in recent months.
- Bonds were mostly flat for the second quarter, with the Bloomberg U.S. Aggregate Bond Index returning 0.7%. Longer-term yields peaked in May amid mounting inflation concerns, but yields eased to end only slightly higher by the end of June as energy prices moderated on reports of continued progress towards a peace agreement between the United States and Iran.
- The Federal Reserve held interest rates steady at its two rate-setting meetings during the quarter. However, expectations for future policy moves shifted from rate cuts to a potential rate hike later this year as new Fed chair Kevin Warsh took office and announced plans to change the manner in which the Fed communicates with markets.
- We remain optimistic about opportunities in the financial markets for the year ahead, due primarily to our expectation for strong corporate earnings growth. Although artificial intelligence (AI) continues to drive rapid innovation, we are mindful of the market’s recent reliance on technology stocks for growth and continue to look for opportunities to further diversify client portfolios.
Second Quarter Review
Heading into the second quarter, equity markets were reeling following the outbreak of armed conflict in Iran and the related spike in energy prices. But stocks found their footing with a strong rebound in April as investors welcomed the early steps toward a resolution of hostilities. Investors generally looked past energy market disruption and inflation spikes fueled by higher gas prices and focused instead on stellar earnings results. According to FactSet, earnings for S&P 500 companies grew 29% year-over-year for the most recent quarter, more than double initial estimates and marking the S&P 500’s sixth consecutive quarter of double-digit earnings growth.
Investors remained broadly optimistic about all things tech, buoyed by continued AI infrastructure investment and the high-profile IPO for SpaceX. The enthusiasm helped the tech sector lead the market in the second quarter, with semiconductors and memory stocks in particular contributing to much of the sector’s outperformance. The PHLX Semiconductor Sector index gained close to 90% for the second quarter, almost triple the return of the broader technology sector, as investors favored semiconductor stocks for their role as the building blocks of the AI boom. Industrials also benefited from AI-related capital expenditures as the big investments made by tech firms flowed through to the companies that are doing the actual construction of the data centers and the infrastructure required to power them.
The market’s overall gains were impressive, but they masked uneven returns beneath the surface; besides tech, no other sector outperformed the S&P 500 for the quarter, while energy reversed its first quarter leadership and was the worst performing sector during the second quarter. The S&P 500 slipped in June but finished with an advance of 15.2% for the quarter and 10.2% for the first half of the year.

Source: YCharts
U.S. small-cap stocks, as measured by the Russell 2000 index, and international stocks, as measured by the MSCI ACWI ex-USA index, continued to outperform the S&P 500 during the first half of the year as lower relative valuations and broader market participation encouraged investors to diversify beyond U.S. large-cap stocks. The AI buildout also lifted earnings expectations for U.S. small-cap and international stocks, especially in emerging markets such as Taiwan and South Korea, which have more concentrated exposure to semiconductors and have benefited from robust demand for memory chips and other data center components.
Source: YCharts
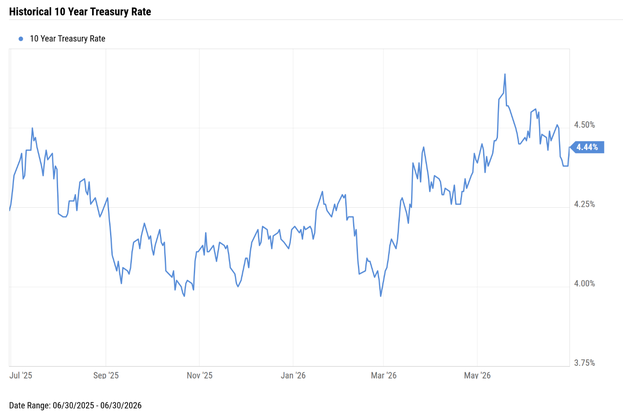
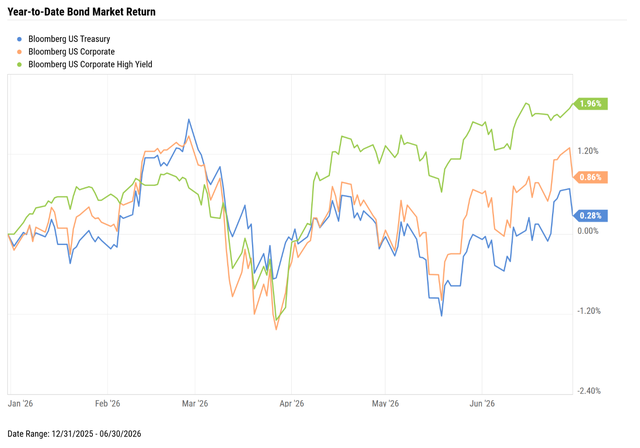
In the bond market, returns were muted as interest rates wavered on inflation worries and energy prices. The 10-year Treasury yield hit 4.7% in mid-May, its highest level in more than a year, as monthly inflation data revealed the impact rising gas prices were having on consumers. Following that peak, yields pulled back through quarter end on hopes of easing tensions between the United States and Iran, and energy prices fell back close to their pre- conflict prices. The improving geopolitical backdrop and a resilient U.S. economy supported by strong corporate earnings helped riskier corporate bonds rebound during the second quarter and finish ahead of U.S. Treasurys for the first half of the year.
Source: YCharts
The second quarter also brought transition at the Federal Reserve as new Fed chair Kevin Warsh took the reins and signaled a less prescriptive approach to communicating the direction of monetary policy. With markets sensing greater uncertainty ahead, expectations for future rate Fed actions shifted at quarter end, from favoring one rate cut in the second half of the year to a higher probability of a rate hike in the coming months.

Source: YCharts
The biggest factor in the market’s change for interest rate expectations was the jump in consumer price inflation, driven primarily by energy prices. The Consumer Price Index (CPI) report for May showed headline inflation reached an annual rate of 4.2%, the fastest pace of consumer price growth in three years. But the impact of higher prices at the gas pump was best seen in comparing this headline rate with core inflation (excluding volatile food and energy prices), which rose at a more modest 2.9% annual rate in May.
Many analysts see the recent rise in inflation as temporary and believe it could quickly recede on a resolution of geopolitical tensions in the Middle East. June’s inflation report appeared to support this view with CPI falling 0.4% for the month, largely due to a drop in energy prices, bringing the annual inflation rate down to 3.5%. This decline could explain why the market is not pricing more than one rate hike in the next 12 months, expecting the Fed to nudge inflation back toward a downward trend if needed rather than taking more drastic steps that could constrain economic growth.
Source: CNBC, U.S. Bureau of Labor Statistics
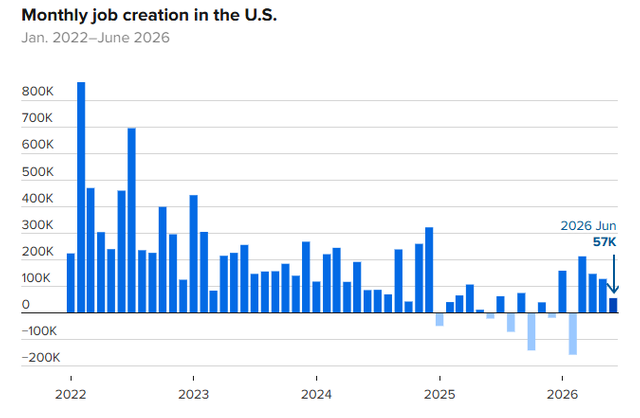
Despite the rise in inflation, the rest of the U.S. economy mostly looked resilient. Economic expansion remained on track, as first quarter real gross domestic product grew 2.7% year-over-year and consumer spending held up throughout the second quarter in spite of higher gas prices. Resilience in labor markets has helped sustain consumer spending as job growth appeared to steady after an uncertain start to the year. Average monthly job growth returned closer to 2024 levels, a sign that last year’s weak labor market may have been a reset, with hiring impacted by a sharp drop off in immigration.
Outlook
Heading into the second half of 2026, we remain optimistic for a good end to the year for markets. Stocks have moved up and down over the last several months based on the likelihood of a deal between the United States and Iran, with the longer-term view that both countries will eventually arrive at an agreement that calms the energy markets and eases inflationary concerns.
The stock market’s impressive rebound during the second quarter highlighted why it is important for investors to stay invested during event-driven market volatility and focus on the fundamentals rather than the day-to-day headlines. Expectations for future earnings growth continue to build on the current uptrend and reinforce why, in our view, financial markets continue to offer attractive opportunities for growth for long-term investors.
At the same time, we believe diversification remains essential for managing market risk. This quarter’s technology rally was impressive, but concerns are beginning to emerge about whether tech companies can continue funding the large amounts of money needed for the AI buildout. With bond and stock issuance already on the rise this year, and more expected as AI platforms Anthropic and OpenAI plan to go public, investors will need to assess how much new issuance markets can absorb without slowing the momentum behind the AI boom. From an investment perspective, we believe investors should remain mindful of how much exposure they have to technology in their portfolios and consider opportunities to shift funds into other sectors that may offer better risk-reward tradeoffs at more reasonable valuations.
The growing likelihood of interest rate hikes by the Fed later this year and higher rates for longer-term bonds has the potential to contribute to increased market volatility in the near term. In our view, the U.S. economy should be able to manage a mild rate hike without major disruptions to employment or overall growth, as long as a hike does not signal a renewed monetary tightening campaign by the Fed. The easing of tensions in the Persian Gulf and the reopening of the Strait of Hormuz would go a long way toward a return to normal in energy markets and hopefully show that recent inflationary pressures are temporary rather than persistent. The situation in the Middle East is one that both the markets and the Fed will be watching closely in the coming months.
Disclosures:
Glassy Mountain Advisors, Inc. is an independent investment adviser registered under the Investment Advisers Act of 1940, as amended. Registration does not imply a certain level of skill or training. More information about Glassy Mountain Advisors including our investment strategies, fees and objectives can be found in our ADV Part 2, which is available upon request.
This material represents an assessment of the market and economic environment at a specific point in time and is not intended to be a forecast of future events, or a guarantee of future results. Forward-looking statements are subject to certain risks and uncertainties. Actual results, performance, or achievements may differ materially from those expressed or implied. Information is based on data gathered from what we believe are reliable sources. It is not guaranteed as to accuracy, does not purport to be complete, and is not intended to be used as a primary basis for investment decisions. It should also not be construed as advice meeting the particular investment needs of any investor. Past performance does not guarantee future results.
Indices are unmanaged and investors cannot invest directly in an index. Unless otherwise noted, performance of indices does not account for any fees, commissions, or other expenses that would be incurred.
The S&P 500 index tracks the 500 most widely held stocks on the NYSE or NASDAQ and is representative of the stock market in general. It is a market capitalization–weighted index with each stock’s weight in the index proportionate to its market value.
The S&P 500 Total Return index tracks capital appreciation as well as distributions. It is a market capitalization–weighted index with each stock’s weight in the index proportionate to its market value. The Total Return index assumes that all cash distributions (dividends and/or interest) are reinvested.
The Bloomberg Barclays U.S. Aggregate Bond Index, or the Agg, is a broad-based, market capitalization–weighted bond market index representing intermediate term investment grade bonds traded in the United States. Investors frequently use the index as a stand–in for measuring the performance of the U.S. bond market.
The PHLX Semiconductor Sector index is a modified market capitalization-weighted index composed of companies primarily involved in the design, distribution, manufacture, and sale of semiconductors.
The Russell 2000 index measures the performance of small capitalization U.S. stocks. The Russell 2000 index is a market capitalization–weighted index of the 2,000 smallest stocks in the broad–market Russell 3000 index.
The MSCI ACWI ex USA Index is a free float-adjusted market capitalization-weighted index that is designed to measure the equity market performance of developed and emerging markets, excluding the United States. The MSCI ACWI ex USA Index captures large and mid cap representation across 22 of the 23 developed markets, including Australia, Austria, Belgium, Canada, Denmark, Finland, France, Germany, Hong Kong, Ireland, Israel, Italy, Japan, the Netherlands, New Zealand, Norway, Portugal, Singapore, Spain, Sweden, Switzerland and the United Kingdom; and 26 emerging markets, including Argentina, Brazil, Chile, China, Colombia, Czech Republic, Egypt, Greece, Hungary, India, Indonesia, Korea, Malaysia, Mexico, Pakistan, Peru, the Philippines, Poland, Russia, Qatar, Saudi Arabia, South Africa, Taiwan, Thailand, Turkey and United Arab Emirates. With over 2,000 constituents, the Index covers approximately 85% of the global equity opportunity set outside the United States.
The Consumer Price Index (CPI) is a measure of inflation compiled by the U.S. Bureau of Labor Statistics.