Quarterly View: January 2026
Jan 12, 2026Listen to an abbreviated version of the commentary below here:
- U.S. stocks rose slightly in the fourth quarter and finished 2025 near record levels, with the S&P 500 gaining 2.7% for the quarter and 17.9% for the full year, including dividends. Bonds also notched another quarter of positive returns, lifting the Bloomberg U.S. Aggregate Bond Index to a gain of 7.3% for 2025.
- Investor enthusiasm for technology and artificial intelligence (AI)-related stocks cooled during the quarter over increasing concerns about rising valuations and heavy spending on data center buildouts. Investors rotated into value-oriented sectors such as health care and financials and continued to favor international stocks.
- The Federal Reserve cut interest rates again in October and December, bringing the total to three rate cuts for the year, but looks likely to pause further rate easing in the coming months as it assesses the economic impact of its latest moves on monetary policy.
- Economic data reporting was impacted by the federal government shutdown in October and November, but subsequent reports showed moderating inflation and strong gross domestic product (GDP) growth despite continued softness in labor markets.
- We remain optimistic about opportunities in the financial markets for the year ahead. With many businesses supported by a solid foundation of earnings growth and the Fed set to maintain monetary policy easing for the time being, provisions in the recently passed tax bill should bolster economic activity while the shock and uncertainty over tariff policy fades to the background.
Fourth Quarter Review
The S&P 500 rose 2.7% in the fourth quarter to close the year with a total return of 17.9%, marking the third straight calendar year of double-digit gains. The current equity bull market crossed the three-year mark this past October due in large part to investors’ ongoing enthusiasm for artificial intelligence, with technology stocks now making up just under 35% of the S&P 500’s total market capitalization and having a large influence on the overall index. Despite carrying the market higher during most of the year, tech stocks lagged the broad stock market during the fourth quarter as worries grew over elevated valuations for AI-related stocks amid continued heavy spending on data center buildouts and rising doubts about the profitability of these large investments. Investors also began to question their increased debt issuance to support the AI buildout, with some commentators drawing similarities to previous tech bubbles.
While investors scrutinized tech stocks with a sharper eye during the fourth quarter, they rotated to more value-oriented sectors such as health care and financials, helping the S&P 500 finish the year near all-time highs. A resilient economy supported by Federal Reserve rate easing and the continuation of strong earnings have underpinned the S&P 500’s impressive returns during the year. According to FactSet, earnings are estimated to grow 8% year-over-year in the fourth quarter, marking the S&P 500’s tenth consecutive quarter of earnings growth and pushing full–year 2025 earnings growth to 12%.

Source: YCharts
After outperforming large–cap stocks during the third quarter due to expectations of lower interest rates, small–cap stocks kept pace with their large–cap counterparts during the fourth quarter and ended the year up 12.8%, as measured by the Russell 2000 index. International stocks continued to shine during the fourth quarter and finished the year with an impressive gain of 32.0%, as measured by the MSCI ACWI ex-USA index, as investors sought to diversify away from the tech-heavy U.S. stock market and preferred the lower relative valuations of international stocks.
On the economic front, trade policy is not the wild card it was earlier in the year, as effective tariff rates have largely remained below announced rates after factoring in trade deals with specific countries and exceptions for certain industries. Although market volatility resurfaced in October after China restricted rare-earths exports and President Trump retaliated with a threat of 100% tariffs on Chinese imports, both countries de-escalated the spat and agreed on a 12-month trade truce. The biggest looming trade issue is a pending decision by the U.S. Supreme Court on the legality of President Trump’s tariff actions. Indications are that the justices appear skeptical of a president’s power to act on tariffs, which are essentially a tax and would therefore fall under the purview of Congress. The consequences of such a decision would probably be mixed; companies that paid higher tariffs may be issued refunds, which would likely undo many of the benefits of the increased tariff revenue on decreasing the deficit, while consumers could see some relief in lower prices if the current tariffs are rolled back.

Source: YCharts
Although the longest federal government shutdown in history had little effect on financial markets, gaps in government data collection and reporting made it difficult to assess what was really happening across the broad U.S. economy during the fourth quarter. There was some improvement in inflation in November; Consumer Price Index (CPI) growth eased to a year-over-year rate of 2.7%, down from 3% in September, but only a half-month of data had been collected and many inconsistencies were apparent. Economists and market analysts were generally reserved in their assessment of the inflation numbers, holding out for more complete information to verify any improvement in CPI growth.
Source: YCharts
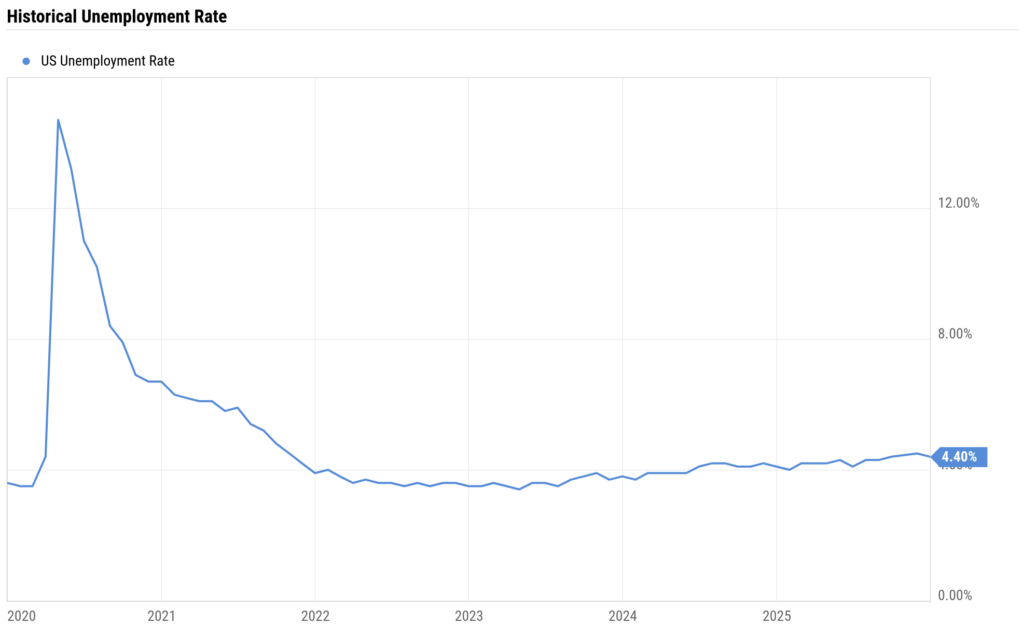
Official employment data were also distorted by the government shutdown, with December’s jobs report offering the first clean look at the labor market in several months. The report painted another mixed picture of the labor market: 50,000 jobs were created in December, below forecasts and weaker than the revised 56,000 jobs created in November, while the unemployment rate dipped to 4.4%. The demand for labor has slowed markedly during the year and underscores a jobs market in which employers are not hiring significantly but layoffs remain low. However, economists and investors seem to be brushing off concerns over the labor market as many believe job growth has slowed primarily because sharply reduced immigration has drained the U.S. workforce of immigrant workers. Some economists have even predicted that the labor market is no longer a source of inflation compared to previous years, a potential silver lining for investors, as wage growth continues to cool.
The indications of moderating inflation and a slowing labor market were enough to convince the Fed to follow up the September rate cut with two more cuts to end the year. As was the case in September, Fed governors continued to focus more on job market softness and less so on inflation pressures to set monetary policy. However, the end of easing may be near as the Fed looks set to pause further cuts until it watches how the economy responds to these recent moves. Judging by December’s GDP reading, which showed the strongest pace of expansion in two years, the economy may not need additional stimulus.

Source: YCharts
With easing monetary policy and a resilient economy, bonds notched another quarter of positive returns, lifting the Bloomberg U.S. Aggregate Bond Index to a gain of 7.3% for the full year. Additionally, riskier corporate bonds outperformed U.S. Treasurys as lower interest rates are expected to ease financing costs for borrowers.
Although the next chair of the Federal Reserve has not yet been announced by President Trump, the leading candidates to replace outgoing chair Jerome Powell in May are all expected to favor Trump’s preference for continued monetary easing. However, it may not be as easy for the next Fed leader to bring rates down further as recent rate-setting decisions have come with evidence of growing dissent among the Fed’s voting members. Current interest rates may also be close to neutral—supportive of employment markets and economic activity, but not so low that inflation heats up. Barring any surprises, it is not likely future economic data will change drastically enough to warrant big moves in monetary policy. As of this writing, market probabilities call for only one or two quarter-point cuts for all of 2026.
Outlook
As we wrap up another strong year of stock returns, we remain optimistic about the market outlook for 2026 with several factors emerging in the coming year that are likely to work in investors’ favor. To start, many of the business- and consumer-friendly provisions in the recent tax bill will come into effect in 2026. The tax law changes should catalyze a wide range of economic activity—from higher business purchases of machinery and equipment, to increased consumer spending as individuals reap tax savings.
One of the biggest economic sticking points from the past year—tariffs—should lessen in 2026 as the shock of higher tariffs wears off and uncertainties around future trade policies are resolved. The higher tariff rates are proving to be more modest than many had feared and not as impactful on consumer price inflation, as evidenced in recent reports of moderating inflation pressures. Despite softer consumer confidence and complaints of higher costs, consumers have continued to spend, with holiday sales expected to have been robust in the fourth quarter. While the Trump administration has pledged to turn its focus towards the economy and improving affordability ahead of this fall’s midterm elections, recent geopolitical actions by the administration – such as capturing Venezuela’s leader, Nicolas Maduro – may serve as a distraction from these priorities.
Earnings have been the foundation for the market’s resilience over the past year and, in our view, should continue to provide support for stocks in 2026. According to FactSet, analysts are projecting S&P 500 companies to report double-digit earnings growth for the third straight year. While it may become harder for companies to post stellar growth rates when compared to this year’s strong performance, we believe the fundamentals for continued profitability are in place and business activity should remain robust. Furthermore, the Fed’s recent moves to cut interest rates help lower borrowing costs and put the U.S. economy on solid footing for continued expansion.
As we head into 2026, the stock market in general appears expensive, which is creating some nervousness among investors. The concern over valuations tends to be narrowly focused on some of the largest tech companies, prompting fears of an AI bubble. These firms are delivering impressive earnings, but it would not be unusual to see some cooling in tech share prices. While we believe that AI continues to present a compelling investment opportunity for investors, our approach remains selective and diversified. We favor tech companies that have taken a disciplined approach to investing in the AI buildout and prefer those with diversified business models, in which multiple segments can complement and support their AI innovations rather than relying on AI as a sole driver of future growth.
We also believe it is an important time to look beyond tech stocks. We believe valuations in other sectors are more attractive, and companies outside of tech are poised to reap the benefits of efficiencies that AI can deliver. Investors should be attuned to the risks of rising valuations, and we believe the best approach to managing these risks is through a diversified portfolio and maintaining a long-term focus on the opportunities for return.
Disclosures
Glassy Mountain Advisors, Inc. is an independent investment adviser registered under the Investment Advisers Act of 1940, as amended. Registration does not imply a certain level of skill or training. More information about Glassy Mountain Advisors including our investment strategies, fees and objectives can be found in our ADV Part 2, which is available upon request.
This material represents an assessment of the market and economic environment at a specific point in time and is not intended to be a forecast of future events, or a guarantee of future results. Forward-looking statements are subject to certain risks and uncertainties. Actual results, performance, or achievements may differ materially from those expressed or implied. Information is based on data gathered from what we believe are reliable sources. It is not guaranteed as to accuracy, does not purport to be complete, and is not intended to be used as a primary basis for investment decisions. It should also not be construed as advice meeting the particular investment needs of any investor. Past performance does not guarantee future results.
Indices are unmanaged and investors cannot invest directly in an index. Unless otherwise noted, performance of indices does not account for any fees, commissions, or other expenses that would be incurred.
The S&P 500 index tracks the 500 most widely held stocks on the NYSE or NASDAQ and is representative of the stock market in general. It is a market capitalization–weighted index with each stock’s weight in the index proportionate to its market value.
The S&P 500 Total Return index tracks capital appreciation as well as distributions. It is a market capitalization–weighted index with each stock’s weight in the index proportionate to its market value. The Total Return index assumes that all cash distributions (dividends and/or interest) are reinvested.
The Bloomberg Barclays U.S. Aggregate Bond Index, or the Agg, is a broad-based, market capitalization–weighted bond market index representing intermediate term investment grade bonds traded in the United States. Investors frequently use the index as a stand–in for measuring the performance of the U.S. bond market.
The Russell 2000 index measures the performance of small capitalization U.S. stocks. The Russell 2000 index is a market capitalization–weighted index of the 2,000 smallest stocks in the broad–market Russell 3000 index.
The MSCI ACWI index is a market capitalization-weighted index that is designed to measure the equity market performance of developed and emerging markets. The MSCI ACWI consists of 47 country indexes comprising 23 developed and 24 emerging market country indexes.
The Consumer Price Index (CPI) is a measure of inflation compiled by the U.S. Bureau of Labor Statistics.